


Molecular cloning
All cloning was performed using standard molecular techniques. Fragments for cloning were generated by PCR using Platinum SuperFi II Master Mix (Thermo Fisher Scientific) and appropriate oligonucleotides (IDT DNA) by plasmid digest using standard restriction enzymes (NEB) or synthesized as gene fragments (Twist Bioscience or IDT DNA). Fragment assemblies were constructed using NEBuilder HiFi DNA Assembly Mix (NEB) or Instant Sticky-end Ligase Master Mix (NEB). Assembled fragments were transformed into self-made chemically competent Escherichia coli DH5α cells. Correct clones were identified by plasmid preparation (Monarch Plasmid Miniprep Kit, NEB) and Sanger sequencing (Azenta) or rolling circle amplification directly on cells (Microsynth). Subsequently, plasmids were isolated using a Plasmid Maxiprep Kit (QIAGEN) and used for transfection. All sequences cloned in this study are listed in Supplementary Table 1.
Plasmid transfection
One day before transfection, cells were seeded at 3.0 × 10⁴ cells per well for 96-well plates, 2.2 × 10⁵ for 24-well plates, 7.5 × 10⁵ for 6-well plates and 4.0 × 10⁶ for 10-cm dishes. Cells were transfected using JetOptimus DNA transfection reagent (Polyplus transfection) with 75 ng DNA per well for 96-well plates, 300 ng DNA per well for 24-well plates, 1 µg DNA per well for 6-well plates, and 5 μg DNA for 10-cm dishes.
Cell culture and cell lines
HEK293T cells (a gift from the Institute of Developmental Genetics, Helmholtz Munich) were cultivated at 37 °C, 5% CO2 in an H2O-saturated atmosphere, and maintained in Dulbecco’s modified Eagle medium (DMEM; Gibco) supplemented with 10% fetal bovine serum (FBS; Gibco) and 1% penicillin–streptomycin (Gibco). The HEK293T split-Luc reporter cell line was generated by Cas9 cleavage at the AAVS1 locus and homology-directed integration of a donor construct containing LgBiT, the carboxy-terminal fragment of Fluc, separated by a P2A sequence, and the puromycin resistance gene. Three days after transfection, the cells were selected for 2 weeks with 2 µg ml−1 puromycin (Thermo Fisher Scientific). HEK293T cells stably expressing EGFR or IL-7Rα were generated by amplification of the EGFR sequence from Addgene plasmid 23935 (a gift from W. Hahn and D. Root), whereas IL-7Rα was synthesized (Twist Bioscience). Both coding sequences were cloned into the AAVS1 knock-in donor plasmid, transfected with AAVS1 targeting Cas9 and selected with 2 µg ml−1 puromycin. Dual-positive EGFR and IL-7Rα receptor cells were generated by cloning of IL-7Rα into an AAVS1 donor plasmid containing a blasticidin resistance gene, and cells were transfected and selected in 10 µg ml−1 blasticidin medium (Thermo Fisher Scientific).
Quantification of STV-mediated target RNA release into the cell culture supernatant
Supernatants from STV-releasing cells were collected and filtered through 0.45-µm polyvinylidene fluoride (PVDF) filters (Merck Millipore) after 48 h. RNA was extracted with a Monarch Total RNA Miniprep Kit (NEB), and isolated RNA was used as a template for quantitative PCR with reverse transcription (RT–qPCR) with a Luna Universal One-Step RT-qPCR Kit (NEB) and a primer/FAM-probe set (custom design, Metabion) specific for EGFP mRNA. The reaction was analysed on a QuantStudio 7 Flex device (Thermo Fisher Scientific).
Integration of diffusion-designed symmetric oligomers into STV design
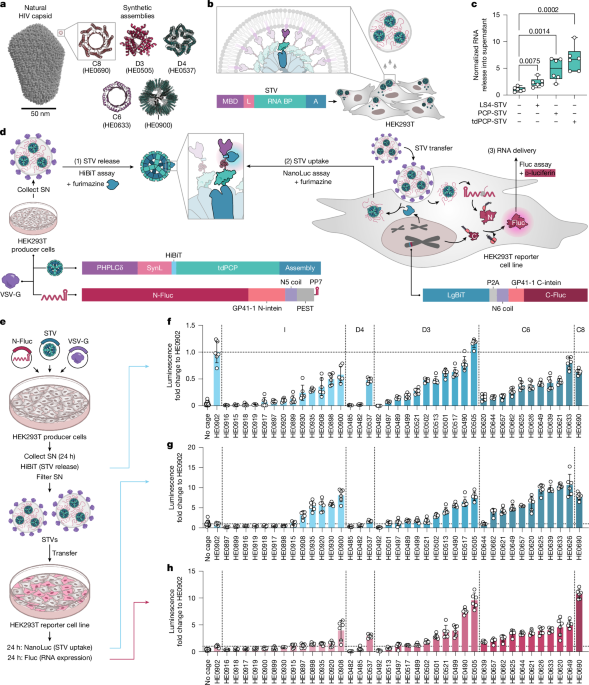
Previously designed RFdiffusion symmetric oligomers were filtered for successfully assembled oligomers on the basis of size exclusion data3. In addition, all D2 symmetric oligomers were excluded. The resulting 39 sequences were synthesized (eBlocks, IDT DNA) and cloned as a C-terminal fusion to the extra STV components (PHPLC, SynL and tdPCP).
Integrating structure-mined membrane-binding domains into STV design
The pleckstrin homology domain (PDB: 1MAI) was used as the input structure for a structure-based homology search with FoldSeek18,40. Ten sequences from three categories (other species, human, metagenome) were selected on the basis of their having the highest homology to the input structure. Each sequence was synthesized (IDT DNA) and fused to the amino terminus of the previously identified ideal STV construct containing SynL, tdPCP and HE0690.
Sequence and structural alignments of the structure-mined membrane-binding domains
The amino acid sequences of the structure-mined membrane-binding domains were aligned to that of R. norvegicus PHPLCδ, using the residues visible in the X-ray structure (PDB: 1MAI). The alignment was performed with the MAFFT v.7 add tool41, using default settings (strategy: auto, scoring matrix: BLOSUM62, gap opening penalty = 1.53, offset value = 0.0). For structural alignment, the structure of the membrane-binding domain region was extracted from the AlphaFold2 (ref. 42) (human and other species membrane-binding domains) or ESMFold19 (metagenomic membrane-binding domains) predictions of the respective structure-mined proteins containing these membrane-binding domains. These structures were aligned, and the root mean square deviation compared with the X-ray structure (PDB: 1MAI) was calculated using the PyMOL super alignment tool.
Screening of symmetric oligomer and membrane-binding proteins for RNA release and uptake
Cells were seeded in 96-well format and transfected with each of the oligomer or membrane STV constructs, as well as plasmids encoding VSV-G and N-split-Luc-PP7 (in a 2:1:7 ratio). Twenty-four hours post-transfection, 5 µl of supernatant was collected from the transfected cells, mixed with 45 µl phosphate-buffered saline (PBS), and measured using a Nano-Glo HiBiT Lytic Detection System (Promega) with a Centro LB960 device (Berthold Laboratories), with 0.5 s integration time. Forty-eight hours post-transfection, 120 µl of supernatant was collected and filtered through a 0.45-µm PVDF 96-well filter plate (Sigma-Aldrich) by centrifugation (1,500g, 4 °C, 20 min). Cleared supernatant was added to a seeded 96-well plate of C-split-Luc reporter cells. Twenty-four hours later, a Nano-Glo Dual-Luciferase Reporter Assay (Promega) was performed on the cells after complete removal of the supernatant. STV uptake was quantified on the basis of light emission from the NanoLuc substrate. N-split-Luc-PP7 mRNA uptake and expression were measured on the basis of the light emission from the Fluc substrate. In addition, total STV protein transfer and Fluc protein expression in target cells were quantified by comparison of luminescent signals obtained from the STV screen with a Fluc reference sample (Abcam) or HiBiT control protein (Promega).
Validation of STV-mediated transfer of EGFP mRNA by flow cytometry
HEK293T producer cells were transfected in 24-well format with plasmids encoding STV constructs, VSV-G and EGFP-PP7 (2:1:7 ratio). STV-containing supernatant was collected for 2 consecutive days, filtered through a 0.45-μm PVDF membrane filter, and concentrated 5- to 10-fold with Lenti-X Concentrator (Takara Bio) in fresh DMEM. Then, 10–20 µl of resuspended STVs were added to a 96-well plate of HEK293T cells. After 24 h, the treated cells were detached using StemPro Accutase (Thermo Fisher Scientific), mixed with FACS buffer (EDTA/bovine serum albumin (BSA)), and filtered through cell-strainer-containing tubes. Subsequently, samples were gated for living single cells, and EGFP mRNA uptake and expression were analysed by flow cytometry (BD FACSaria III, BD Biosciences). Data were analysed using BD FACSDiva (v.6.1.3, BD Biosciences) and FlowJo (v.10, BD Biosciences).
Design of extra oligomers with C8 symmetry
Extra oligomers featuring C8 symmetry were generated using the open-source version of RFdiffusion, along with the script provided for symmetric oligomers3. These computations were performed on a single A100 GPU.
Determination of subcellular STV localization
HEK293T cells were transfected with STV constructs containing different membrane-binding domains. Twenty-four hours later, cells were fixed with 10% formalin (Sigma-Aldrich) and permeabilized in 1% BSA/0.5% Triton X-100 (diluted in PBS). Permeabilized cells were incubated with primary anti-HA antibody (Sigma-Aldrich, H3663) overnight at 4 °C. Subsequently, the cells were washed and stained with an Alexa 488-coupled secondary donkey anti-mouse antibody (Thermo Fisher Scientific, A21202) overnight at 4 °C. Stained cells were mounted with ProLong Diamond reagent (Thermo Fisher Scientific) and imaged using an Axio Imager M2 fluorescence microscope (Carl Zeiss).
Characterization of packaging capacity by flow cytometry
EGFP-PP7-STVs were produced in 24-well format as previously described. In addition, producer cells were transfected with mRuby3-PP7 constructs containing random UTR sequences of variable lengths. Concentrated STVs were added to HEK293T target cells. After 24 h, EGFP and mRuby3 expression levels were quantified using flow cytometry as described previously.
Concentration of STVs by ultracentrifugation for analytical and experimental purposes
Producer cells were seeded in 10-cm dishes coated with poly-l-lysine (Sigma-Aldrich) and transfected with plasmids encoding STV-C8 components required for the respective experiments. Unless otherwise specified, supernatants were collected for 3 consecutive days and stored until day 3 at 4 °C. The collected supernatant was centrifuged for 5 min at 1,000g and passed through a 0.45-μm PVDF membrane filter. Filtered supernatant was added to a cushion of 20% (w/v) sucrose (Sigma-Aldrich) in PBS. Subsequent ultracentrifugation was performed at 26,000 rpm for 2 h and 4 °C using a SW28 rotor in an Optima L-60 ultracentrifuge (Beckman Coulter). After centrifugation, the supernatant and the sucrose solution were removed, and the pellet was resuspended in 50 µl ice-cold 1× PBS (Thermo Fisher Scientific) on an orbital shaker at 150 rpm for 45 min at 4 °C. The resuspended pellet was centrifuged at 1,000g for 5 min at 4 °C for removal of debris and stored at −80 °C. Following this process, samples were concentrated approximately 300-fold.
Determination of STV purity for downstream analysis
STV-C8 samples were concentrated by ultracentrifugation, and sample purity was determined by silver staining. Samples were prepared in 2× Laemmli buffer (Sigma-Aldrich) for 10 min at 98 °C. SDS–PAGE was run on a TGX gel with a 4–15% gradient (Bio-Rad) using 1× Tris/glycine/SDS running buffer (Bio-Rad) for 60 min at 130 V. Subsequently, the gel was silver-stained according to the manufacturer’s instructions (Serva). A gel was run in parallel with the same samples and blotted on to a nitrocellulose membrane for 60 min, at 100 V and 4 °C, in transfer buffer (Tris/glycine buffer, Bio-Rad). The position of the STV-C8 protein on the membrane was determined by imaging with a Nano-Glo HiBiT Blotting system (Promega) in a Fusion SL Vilber machine (Peqlab). The HiBiT signal on the membrane was used as a reference to identify STV proteins on the corresponding silver-stained gel.
Sample and grid preparation for cryo-ET
Seeded producer cells were transfected with plasmids encoding STV-C8 and EGFP-PP7 in 10-cm dishes coated with poly-l-lysine (Sigma-Aldrich). Twenty-four hours after transfection, the cells were washed with PBS, and serum-free DMEM was added. After a further 24 h, the supernatant was collected and concentrated by ultracentrifugation, as previously described. The purified STV-C8 vesicles were diluted to 109 particles per microlitre in PBS. Samples were applied to copper EM grids with Quantifoil R 3.5/1 holey carbon films (200 mesh, Quantifoil) and covered with a homemade 3-nm-thick continuous carbon film produced by flotation. The grids were then glow-discharged at 4 mA for 10 s, blotted and plunge-frozen into liquid ethane using a Vitrobot IV (Thermo Fisher) with the chamber set to 95% humidity at 10 °C. A total of 16 grids were prepared in 2 experiments.
To further characterize the size distribution of STV-C8 vesicles, we prepared a gradient of iodixanol (15%, 25%, 40% and 60%) in PBS-MgCl2/KCl/NaCl buffer. Supernatant containing STV-C8 vesicles was produced as described previously with FBS, applied to the iodixanol gradient and concentrated by ultracentrifugation (26,000g at 4 °C for 4.30 h). Subsequently, the fractions were collected by puncturing the tube wall with a 27-G needle. The collected samples were applied to 200 mesh copper EM grids with Quantifoil R 3.5/1 holey carbon films and covered with a homemade 3-nm-thick continuous carbon film produced by flotation. The grids were glow-discharged at 4 mA for 10 s, blotted and plunge-frozen into a liquid ethane/propane mix using a Vitrobot IV (Thermo Fisher) with the chamber set to 95% humidity at 4 °C. A total of 18 grids were prepared in 1 experiment, with 2 grids for each triplicate of the 3 conditions (15%, 25% and 40–60% iodixanol).
Cryo-ET data acquisition, reconstruction, and quantification of vesicle and assembly sizes
Tilt series were acquired using Tomo5 software on a Titan Krios G4 transmission electron microscope (Thermo Fisher Scientific) equipped with a cold-FEG (operated at 300 kV), a Falcon IVi camera and a Selectris X energy filter. Tilt series were acquired at a magnification of ×81,000, corresponding to a pixel size of 1.63 Å, from −60° to 60°, at 2° tilt increments and using a dose-symmetric tilt scheme. The total dose was 122 e− per Å2, and the target defocus varied between −2.5 µm and −4 µm. Data were collected in EER format. Statistical analyses of vesicle size distribution were performed on search maps at ×11,500 magnification using Tomo5. For the first experiment with purified STV-C8 vesicles in PBS, at least 500 search map micrographs were collected for each grid. For the second experiment involving the iodixanol gradient, 1,125 search map micrographs were collected for each grid.
For tomogram reconstruction and segmentation, tilt series were aligned and reconstructed using AreTomo3 (ref. 43) (binned by a factor of 4, with a final pixel size of 6.52 Å per pixel). Frame alignment and CTF estimation were performed using the MotionCor3 (ref. 43) and GCtfFind44 implementations, respectively, in AreTomo3. The aligned tilt series were manually inspected, and problematic tilts were removed before reconstruction. Membranes were segmented using MemBrain-seg, and particles were manually segmented in Amira45 (Thermo Fisher Scientific).
Assembly size homogeneity was assessed by morphometric analysis of cryo-electron tomograms. The diameters of 500 individual assemblies were measured directly from tomographic slices using calibrated pixel distances. Measurements were converted to physical units on the basis of the tomogram pixel size and compiled to generate a frequency distribution of assembly sizes.
Characterization of STV particles obtained from iodixanol gradient
STV-C8(EGFP) vesicles were purified through iodixanol gradients as described in the previous section. Subsequently, RNA was extracted from the three fractions, and the relative amounts of EGFP mRNA in the fractions were analysed by RT–qPCR. STV protein content was characterized by HiBiT measurement, and the delivery efficiency was measured by addition of the fractions to target cells and analysis of EGFP expression by flow cytometry after 24 h.
Prediction of STV-C8 multimer structure
The sequence of STV-C8 (UaPHPLC-SynL-tdPCP-HE0690) was fed into the AlphaFold3 server with octameric settings46. The obtained structure file was coloured to represent pLDDT (predicted local distance difference test) scores and was captured in two orientations.
Live measurement of STV-C8 uptake kinetics
STV-C8 vesicles enveloped with VSV-G were produced and transferred to split-Luc reporter cells, which had been seeded in black-walled 96-well plates the day before. Nano-Glo Endurazine live substrate (Promega) was added to transduced cells, and the plates were subsequently transferred to a Cytation 3 plate reader (Agilent). The luminescence signal from HiBiT/LgBiT reconstituted nanoluciferase was recorded at 15-min intervals for 3 days.
Characterization of STV-C8 RNA content
STV-C8 particles were produced and purified as described in the previous section. RNA was isolated from the particles, as well as from corresponding producer cells, using a Monarch Total RNA Miniprep Kit (NEB). Subsequently, Illumina RNA sequencing library prep and sequencing with 20 million paired-end reads per sample were performed on a NovaSeq device. Sequencing reads were mapped to the human reference transcriptome using the STAR aligner, and differential expression was analysed using DESeq2. Library preparation, sequencing and data analysis were performed by Azenta (Leipzig).
Characterization of STV-C8 protein content
STV-C8 were produced and purified as described in the previous section. Total protein was extracted by lysing the sample with lysis buffer (PreOmics) supplemented with cOmplete Protease Inhibitor (Roche). The released protein was quantified by BCA assay (Thermo Fisher Scientific). Then, 10 µg of protein per sample was further processed by filter-aided sample preparation47 and measured on a QExactive HFx mass spectrometer online coupled to a Ultimate 3000 RSLC (Thermo Fisher Scientific). Data were analysed by label-free quantification in MaxQuant 2.4.9.0 (MPI)48 using a merged dataset comprising the SwissProt human protein database and the sequences of exogenously expressed proteins. Statistics were analysed in Perseus (MPI)49.
RNA and protein gene set enrichment analysis
Significantly enriched or depleted genes (adjusted P < 0.005, log2[fold change] +3/−3) or proteins (−log q < 0.05, log2[fold change] +3/−3) were identified, and gene set enrichment analysis was performed using gProfiler2 with default options (e111_eg58_p18_30541362).
Native PAGE of purified STV-C8 vesicles
HEK293T cells were transfected with STV-C8 and an unrelated control plasmid in T175 flasks coated with poly-l-lysine (Sigma-Aldrich). Twenty-four hours after transfection, the cells were washed with PBS, and serum-free DMEM was added. Another 24 h later, the supernatant was collected and concentrated by ultracentrifugation as described before. Concentrated supernatants were lysed with M-PER (Thermo Fisher) for 10 min at room temperature. Lysates were mixed in a 1:4 ratio with native PAGE sample buffer (Invitrogen) and loaded on to a 12% Tris-glycine gel (Invitrogen) with a NativeMark Unstained Protein Standard (Invitrogen). The gel was run for 2 h at 150 V using Tris/glycine buffer (Bio-Rad). Afterwards, the gel was stained with Coomassie solution (Thermo Fisher) for 30 min and imaged using a Fusion SL Vilber machine (Peqlab).
Benchmarking of EGFP mRNA delivery efficiency of STVs compared with SEND, EPN and VLP
SEND/MmPeg10 was ordered from Addgene (174858; a gift from F. Zhang), and the EPN-MCP, VLP-MCP, EGFP-MS2 and SEND-EGFP constructs were synthesized by Twist Bioscience and cloned into CAG promoter expression backbones. For each system, the corresponding capsid scaffold and cargo RNA plasmids, encoding EGFP, were cotransfected with the VSV-G plasmid in 24-well format. Supernatants were produced for 48 h and concentrated as previously described. Concentrated vehicles were added to a 96-well plate of HEK293T, Vero E6, N2a and HepG2 cells (all other cell lines were gifts from the Institute of Virology, Helmholtz Munich). Twenty-four hours later, EGFP expression was analysed by flow cytometry as described earlier.
In addition, a reporter plasmid consisting of a lox-stop-lox cassette upstream of the EGFP-coding sequence was cloned. VLP (205525), EPN (205555) and SEND (174858) coding plasmids and Cre cargo plasmids (174862 and 205559) were ordered from Addgene and directly compared with STV-C8 packaging Cre mRNA without any modification of the constructs. Each plasmid was cotransfected with its respective Cre cargo plasmid and VSV-G in a 10-cm dish. The supernatant for each condition was produced for 72 h and concentrated by ultracentrifugation as previously described. HEK293T cells were transfected with the lox-stop-lox reporter plasmid and transduced with two concentrations of concentrated supernatants after 24 h. After a further 24 h, EGFP expression was analysed by flow cytometry.
Benchmarking of STV against LNP characteristics in vitro and in vivo
A plasmid encoding EGFP under the control of the T7 promoter was cloned. The plasmid was linearized by digestion downstream of the stop codon, leaving a 3′ UTR of similar length to that in the STV cargo plasmid. The reaction product was purified (Monarch DNA Cleanup Kit, NEB) and used as a template for in vitro transcription (HiScribe T7 Quick High Yield RNA Synthesis Kit, NEB). Subsequently, the RNA was purified (Monarch RNA Cleanup Kit, NEB) and capped with a Vaccinia Capping System (NEB). The reaction product was purified again and polyadenylated with E. coli poly(A) polymerase (NEB). After a final purification step, the EGFP-coding mRNA was diluted to 150 ng μl−1 in 20 mM citrate buffer (pH 4.0). LNPs were composed of ALC-0315 (Cayman Chemical, 34337), DOPE (Avanti Polar Lipids, 850725), cholesterol (ChemCruz, sc-202539) and DMG-PEG 2000 (Avanti Polar Lipids, 880151) in a ratio of 50:10:38.5:1.5. The lipid and RNA solutions were quickly mixed in a 1:3 volume ratio, resulting in a final weight ratio of 40:1. Then, 1 μl of the prepared sample was diluted in 3 ml of PBS in a cuvette (Sarstedt) and analysed by dynamic light scattering using a Zetasizer Pro (Malvern Panalytical). STV-C8 particles containing EGFP mRNA were prepared by ultracentrifugation, as described previously. The absolute STV-C8 protein content was determined by extrapolation from a HiBiT Control Protein (Promega) standard curve. EGFP mRNA content of STV-C8 particles was determined by absolute RT–qPCR quantification (Luna Universal One-Step RT-qPCR Kit, NEB) with an in vitro-transcribed EGFP mRNA standard, and the STV-C8 particle number was determined by dynamic light scattering.
The delivery efficiency of STV-C8 was compared with that of LNPs on two levels. First, the amount of mRNA required to induce EGFP expression in the same percentage of transfected cells was measured by titration of STV or LNP on target cells and subsequent analysis of EGFP expression by flow cytometry. Second, the expression levels induced by mRNA delivery for the two vehicle types were compared. STV-C8 or LNPs were titrated to induce EGFP expression in 50% of cells. EGFP expression levels at the respective mRNA concentrations were measured by flow cytometry and used to calculate the (theoretical) dose of mRNA required to induce one mean fluorescence intensity unit.
Then, 8-week-old female C57BL/6 mice were intravenously injected with 150 µl of either LNPs or concentrated STV-C8 formulated with Akaluc mRNA (both vehicles were prepared as previously described). At 24 h after administration of the vehicles, mice received 150 µl of 33 mM TokeOni substrate by intraperitoneal injection. Bioluminescence was subsequently measured using an IVIS Lumina S5 imaging system (PerkinElmer) with an exposure time of 20 s. Animal experiments were performed according to the institutional guidelines of the Helmholtz Munich Center German Mouse Clinic after approval of the Ethical Review Board of the Government of Upper Bavaria (Regierung von Oberbayern, Munich, Germany).
Analysis of STV-C8-induced interferon signalling
A549-IFN-GFP cells (a gift from R. Bartenschlager) that reported interferon signalling by GFP expression were transfected with luciferase plasmid DNA as a positive control for interferon stimulation and treated with STV-C8 particles containing a luciferase mRNA. GFP expression following treatment was monitored after 24 h using an EVOS imaging device (Thermo Fisher Scientific).
In addition, in vitro-transcribed mTagBFP2 mRNA was produced as previously described, using N1-methylpseudouridine (Jena BioScience) or unmodified uridine. A549-IFN-GFP reporter cells were treated with STV-C8 containing mTagBFP2 mRNA or LNPs containing modified or unmodified mTagBFP2 mRNA to induce similar expression levels of mTagBFP2. Subsequently, activation of IFN–GFP expression was measured by flow cytometry.
Comparison of LNP and STV-C8-induced cytotoxicity
HEK293T cells were seeded in 96-well plate format, transfected with 50 ng EGFP mRNA-containing LNPs and transduced with purified STV-C8(EGFP) particles. Both particle types were used at a concentration that induced EGFP expression in approximately 50% of cells. After 24 h, cells were detached with 0.05% trypsin (Thermo Fisher Scientific), resuspended in Annexin V binding assay buffer (10 mM HEPES, 140 mM NaCl and 2.5 mM CaCl2 (pH 7.4)) and labelled 1:100 with Annexin V-iFluor 680 (Abcam). Subsequently, Annexin V staining intensity was quantified using flow cytometry.
Establishing cell-type-specific STV-C8 by peptide binder engineering
Previously designed EGFRn, EGFRc and IL-7Rα minibinders28 or an CD19 scFv were exposed on the STV-C8 surface by expressing them as fusion constructs consisting of a signal peptide, minibinder sequences and a transmembrane domain, along with STV-C8 components and an LDLR-binding deficient mutant of VSV-G (K63Q, R370Q27). Transfections were performed in 6-well plates with EGFP mRNA cargo, and the supernatant was collected for 48 h and concentrated with Lenti-X concentrator (Takara Bio). Then, 30 μl of concentrated supernatant was transferred to either wild-type HEK293T cells or HEK293T cells stably expressing the EGFR or IL-7Rα receptor, and 24 h later, EGFP expression was analysed by flow cytometry as described earlier.
STV-C8-mediated EGFP mRNA delivery into RPE spheroids isolated from human retinal organoids
Human retinal spheroids were differentiated from a human IPS cell (hiPS cell) line (F49B7) derived from healthy donors and tested for pluripotency markers and germ layer differentiation potential. hiPS cells were seeded on six-well plates coated with Matrigel (Corning) and cultured in mTeSR Plus medium (STEMCELL Technologies). The medium was changed every 2 days. At 70% confluency, iPS cells were passaged in small clumps using 0.5 mM EDTA (0.5 M (pH 8.6); Thermo Fisher Scientific). On day 0, hiPS cells were dissociated as small aggregates using 0.5 mM EDTA. The aggregates were suspended in cold Matrigel (GFR, Corning) and incubated at 37 °C for 20 min to allow gelling. hiPS cell–Matrigel aggregates were gently dispersed in neural induction medium (DMEM/F12 + GlutaMAX, 1% B27 with vitamin A supplement, 0.5% N2 supplement, 0.1 mM 2-mercaptoethanol, 2 mM GlutaMAX and 1% penicillin–streptomycin; all from Thermo Fisher Scientific). The aggregates were cultivated in ultra-low adherent six-well culture plates (Costar, Corning). On day 5, floating cysts were seeded on Matrigel-coated 6-well plates. On day 15, cysts were detached by addition of dispase (0.5 mg m−1 in DMEM/F12; STEMCELL Technologies) for 3–4 min at 37 °C, followed by washing with DMEM/F12 medium and growth in the retinal differentiation medium (DMEM/F12 + GlutaMAX, 2% B27 without vitamin A, 1% non-essential amino acids (NEAA) and 1% penicillin–streptomycin; all from Thermo Fisher Scientific). On day 25, immature retinal spheroids were transferred to retinal maturation medium (DMEM/F12 + GlutaMAX, 8% FBS, 2% B27 without vitamin A, 1% NEAA, 1% antibiotic–antimycotic (all from Thermo Fisher Scientific) and 1% 100 mM taurine from Sigma-Aldrich). Half of the medium was changed every 2–3 days, and all spheroids were cultured in a humidified incubator at 37 °C and 5% CO2 until the end of the experiment. Retinal pigment epithelium was developed during generation of the retinal spheroids in the form of patches attached to the spheroids. On day 200, RPE spheroids were dissected from human retinal spheroids. Then, they were sorted into a 96-well U-bottomed ultra-low-attachment plate (Nucleon Sphera, Thermo Scientific), with each well containing 3–4 RPE spheroids. The RPE spheroids were transduced with 10 µl of STV-C8(EGFP)/VSV-G or STV-C8(EGFP), fixed 2 days after treatment and then gradually dehydrated in 10% sucrose at room temperature, 30% sucrose at room temperature, and 50% sucrose overnight at 4 °C. The spheroids were embedded in Tissue-Tek O.C.T. compound (Sakura) and immediately frozen at −80 °C until solidification occurred. They were then sectioned at 10-µm thickness using a cryostat (Leica CM3050 S, Leica Biosystems). Cryosections were rehydrated and incubated in a 5% chemo-blocker solution (Merck) for 30 min, followed by 30 min incubation in 0.3% Triton X. Sections were incubated overnight at 4 °C with anti-RPE65 (Proteintech, 17939-1-AP) and anti-GFP (Santa Cruz, sc-101536) primary antibodies diluted in 5% chemo-blocking solution; the sections were washed three times in PBS, then were further incubated for 1 h at room temperature with goat anti-rat Alexa Fluor 488 (Thermo Fisher Scientific) and donkey anti-rabbit Alexa Fluor 555 (Thermo Fisher Scientific) secondary antibodies diluted in 5% chemo-blocking solution. Finally, the sections were washed with PBS and mounted using Fluoroshield with DAPI (Sigma-Aldrich). Immunolabelled RPE spheroids were imaged using a Leica TCS SP8 spectral confocal laser scanning microscope (Leica Microsystems).
EGFP delivery into human monocytes
Primary human monocytes (ATCC, CRL-3622) were seeded in 96-well format. Then, 5 µl of concentrated EGFP-mRNA-containing STVs were added to the cells, and EGFP expression was analysed by flow cytometry 24 h later.
Isolation of primary astroglia from mouse postnatal cortex and Ascl1 mRNA delivery
Primary astrocytes were isolated from the cerebral cortex of postnatal day 5 C57BL/6N mice. The cortex was isolated, cut into small pieces and mechanically dissociated by vigorous pipetting. Subsequently, the cell suspension was centrifuged for 7 min at 1,300 rpm, and the cell pellet was plated in a T25 flask and cultivated for 7–13 days in DMEM/F12 + GlutaMAX, supplemented with 10% FBS, 10% penicillin–streptomycin, 5% horse serum, 4.5 g l−1 d-(+)-glucose, 2% B27, 10 ng ml−1 bFGF and 10 ng ml−1 EGF (all from Thermo Fisher Scientific). After reaching 90% confluency, the cells were passaged using 0.05% Trypsin/EDTA (Thermo Fisher Scientific), and approximately 75,000 cells were seeded on to glass coverslips coated with poly-d-lysine (Sigma-Aldrich). Twenty-four hours later, 15 µl of concentrated EGFP or Ascl1-P2A-EGFP-containing STV-C8 was added to the cells. After 48 h, cells were fixed in 10% formalin (Sigma-Aldrich) and incubated with anti-GFP (Abcam, ab13970) or anti-Mash1 (Abcam, ab211327) primary antibody in PBS containing 1% BSA (Sigma-Aldrich) and 0.3% Triton X-100 (Sigma-Aldrich) overnight at 4 °C. After washing, the cells were stained with Alexa 488-coupled donkey anti-chicken (Dianova, 703-546-155) or Alexa594-coupled donkey anti-rabbit (Thermo Fisher Scientific, A21207) secondary antibody for 1–2 h in the dark at room temperature. Subsequently, cells were stained with DAPI, coverslips were mounted using Aqua Poly/Mount (Polyscience), and samples were imaged using an Axio Imager M2 fluorescence microscope (Carl Zeiss).
Deletion of exon 51 of dystrophin gene in primary porcine fibroblasts
Two Cas9 sgRNA plasmids containing a PP7 motif in the stem–loop of the sgRNA, along with porcine dystrophin targeting spacers, were cloned. The sgRNAs targeted intron 50 (AGAGTTCCTAAGGTAGAGAG) and intron 51 (ATAAAGATAAGAGCTGGCAG) to delete exon 51 (ref. 13). In addition, a plasmid encoding nuclear localization signal (NLS)- and nuclear export signal (NES)-fused Cas9, along with a 3′ UTR PP7 motif, was cloned. HEK293T producer cells were seeded in 10-cm dishes coated with poly-l-lysine and cotransfected with Cas9 mRNA and the two sgRNA plasmids (in a 1:1:1 ratio), along with STV-C8 and VSV-G coding plasmids. STV-C8 particles were collected and concentrated by ultracentrifugation as described before. Pig primary fibroblasts were seeded in a collagen-coated 48-well plate in DMEM50 supplemented with 1% NEAA, 10 mM HEPES and 15% FBS (all from Thermo Fisher Scientific) and 2-mercaptoethanol (Merck). Seeded cells were treated with 20 µl STVs for 72 h. Subsequently, genomic DNA was extracted using a Monarch Genomic DNA Purification Kit (NEB), and a 2-kb fragment covering the deleted region was amplified (primers: CCCATGACATTTACCCTATTATTATCCC and GCTAATGTTCATTTTAAAAAGGAATCTGTC) using Platinum SuperFi II Master Mix (Thermo Fisher Scientific). The PCR product was run on a 1.5% agarose gel and imaged.
Treatment of SARS-CoV-2-infected iPS cell-derived human lung cells with STV-delivered Cas13d-NCS
For lung cell differentiation, hiPS cells (ISFi001-A, RRID: CVCL_YT30) were cultured in StemMACS medium (Miltenyi Biotec) on plates coated with Geltrex Reduced Growth Factor (Thermo Fisher Scientific). At 70% confluence, iPS cell colonies were isolated as a single-cell suspension with Accutase (Thermo Fisher Scientific) for 5 min at 37 °C, neutralized with StemMACS medium and centrifuged for 3 min at 200g at room temperature; then, 1.0–1.2 × 10⁶ cells were seeded on to non-adherent 6-well plates (Corning, 3471) in StemMACS medium supplemented with 10 μM Y-27632 (Enzo Life Sciences). Differentiation basal medium (DBM) was prepared with DMEM/F12 1:1 and GlutaMAX (Thermo Fisher Scientific) supplemented with 1× NEAA (Thermo Fisher Scientific), 0.1% Albumax (Thermo Fisher Scientific) and 1× B27 (Thermo Fisher Scientific). Formation of embryonic bodies was induced by changing the medium to 50% StemMACS medium/50% DBM with 20 ng ml−1 activin A (Bio-Techne). The medium was replaced entirely with DBM with 20 ng ml−1 activin for 48 h. Definitive endoderm (days 0 to 5) was induced by plating embryonic bodies on to plates coated with Geltrex Reduced Growth Factor at 7 embryonic bodies per cm2 of culture surface in DBM supplemented with 150 ng ml−1 activin A and 25 ng ml−1 bone morphogenic protein 4 (BMP4) (Thermo Fisher Scientific) for 5 days with daily medium changes. Anteriorization of definitive endoderm (days 6 to 10) was elicited by changing DBM supplements to 50 ng ml−1 EGF (Invitrogen), 50 ng ml−1 bFGF (Thermo Fisher Scientific), 3 μM SB431542 (Miltenyi Biotec) and 10 ng ml−1 Noggin (Sigma-Aldrich) for 5 days with medium changes every day. Lung progenitors giving rise to type II alveolar epithelial cells (days 10 to 17) were generated by changing the medium to DBM containing 50 ng ml−1 BMP2 (Thermo Fisher Scientific), 50 ng ml−1 FGF10 (Peprotech), 50 ng ml−1 BMP4, 50 ng ml−1 bFGF and 50 ng ml−1 WNT3A (Bio-Techne) for 7 days. Successful differentiation into alveolar epithelial cells was confirmed by analysis of expression of ACE2 and SLC34A2 by RT–qPCR (Luna Universal One-Step RT-qPCR, NEB). In addition, NLS- and NES-containing Cas13d-NCS32 was cloned into a PP7-motif-containing backbone in the 3′ UTR, and a PP7 motif was attached 3′ to a crRNA, targeting the SARS-CoV-2 3′ UTR region (GUCAUCCAAUUUGAUGGCACCUG). Subsequently, lung progenitor cells were seeded into Geltrex-coated 96-well plates at a density of 2 × 10⁴ cells per well (Merck) and differentiated for 7 days in differentiation medium. Differentiated lung cells were transduced with 40 μl concentrated STV-C8 containing Cas13d-NCS/SARS-CoV-2 or non-target crRNA. Twenty-four hours later, the cells were infected with SARS-CoV-2-GFP (multiplicity of infection: 10), and viral replication was monitored for 72 h in an Incucyte S3 live imaging system (Sartorius).
Analysis of STV-C8 inactivation in human blood samples
Peripheral blood mononuclear cells (PBMCs) were isolated by diluting blood in 2–4 times the volume of PBS. Then, 35 ml of the diluted blood suspension was carefully layered on to 15 ml of Ficoll (density = 1.077 g ml−1) in a Falcon tube, and the tube was centrifuged without brake at 400g for 30 min at 20 °C. After centrifugation, the upper layer was aspirated, leaving PBMCs at the interphase. The PBMC layer was transferred to a fresh Falcon tube, which was filled with PBS and centrifuged again at 300g for 10 min at 20 °C. The resulting cell pellet was resuspended in PBS, and cell counting was performed using Trypan blue staining. For long-term storage, PBMCs were frozen at a density of 1 × 10⁷ cells ml−1 in FBS supplemented with 20% dimethyl sulfoxide. Blood samples were collected in EDTA-free tubes for isolation of blood serum. The tubes were gently inverted several times to mix the blood, and the samples were then allowed to clot at 4 °C for 3–4 h. After clotting, the samples were centrifuged at 2,500g for 10 min at room temperature. The top clear layer (serum) was carefully transferred to new sterile microcentrifuge tubes or storage vials using a sterile pipette. For long-term storage, aliquoted serum was stored at −80 °C. STV-C8(N-split-Luc) particles were produced in 24-well plates and collected for 48 h. The collected supernatant was concentrated using Lenti-X (Takara Bio) as described. Then, 30 μl of concentrated STV-C8 particles were mixed with 30 μl of 1:10 diluted serum and 30 μl of resuspended PBMCs (approximately 3.0 × 10⁵ cells) or PBS and incubated at 37 °C for 60 min. After the incubation period, 50 μl of STV-C8 with PBMCs or serum mix was transferred to a 96-well plate of split-Luc reporter cells. The next day, N-split-Luc RNA expression was analysed using ONE-GloEX Luciferase (Promega) assay.
Testing of STV-C8 storage conditions
STV-C8(N-split-Luc) were produced in 6-well format for 2 days, concentrated using Lenti-X (Takara Bio), and stored for 7 days at 4 °C or −80 °C. Subsequently, 50 µl of stored samples was added to split-Luc reporter cells. The next day, N-split-Luc RNA expression was analysed using ONE-GloEX Luciferase (Promega) assay.
Delivering of OpenCRISPR-1 with STV-C8
The coding sequence of OpenCRISPR-1 was ordered from Twist Bioscience and cloned into a CAG-promoter-containing expression plasmid. The coding sequence was fused to two NLS signals and one NES signal, and the PP7 aptamer was added to the 3′ UTR. In addition, an sgRNA containing the PP7 aptamer in the stem–loop region and a spacer targeting the stop codon in eTLR cells was cloned (GCUCCCACAACGAAGACUGAC; the cells were a gift from the Institute of Synthetic Biomedicine, Helmholtz Munich)30. STV-C8 particles containing OpenCRISPR-1 or Cas9 and the sgRNA were produced in 6-well format for 3 days and concentrated using Lenti-X (Takara Bio), and 20 µl concentrated particles were added to a 96-well plate of eTLR cells. Three days later, the cells were imaged using an EVOS imaging device (Thermo Fisher Scientific).
Analysis of mouse whole-body biodistribution of STV-C8-mediated EGFP expression
STV-C8(EGFP) or empty STV-C8 vesicles were produced in coated 10-cm dishes for 3 days and concentrated by ultracentrifugation as described before. Then, 50 µl of concentrated STV-C8(EGFP) samples were injected intravenously into 4-week-old female BALB/c wild-type mice (Charles River Laboratories) in accordance with institutional animal care guidelines and with approval by the Ethical Review Board of the Government of Upper Bavaria (Regierung von Oberbayern, Munich, Germany). The mice were euthanized 24 h or 72 h after injection and intracardially perfused with heparinized PBS (10 U ml−1 heparin) and 4% paraformaldehyde. The skin was removed, and the bodies were fixed in 4% paraformaldehyde overnight at 4 °C. Then, vDISCO whole-body staining and clearing were performed as previously described33; in brief, the steps comprised decolourization (25% CUBIC reagent in PBS), decalcification (10% (w/v) EDTA in PBS), signal-enhancement with anti-GFP nanobodies (Chromotek, anti-GFP-AF647), dehydration (with tetrahydrofuran), delipidation (with dichloromethane) and refractive-index matching with a mixture of benzyl alcohol and benzyl benzoate. A Blaze light-sheet system (LaVision BioTec) with an axial resolution of 4 µm was used for light-sheet imaging. Full-scale mouse body imaging was performed using a ×4 magnification objective (Olympus XFLUOR ×4 corrected/0.28 numerical aperture; working distance: 10 mm). High-magnification tile scans were obtained with 22% overlap, and the light-sheet width was reduced to 80%. For the z-step, the size was set to 6 µm, with time exposures of 40 ms in the background channel (488 nm) and 60 ms in the signal channel (640 nm, 647-boosted GFP signal). A Fiji plugin was used to stitch the raw TIFF files to a full plane. The individual planes were merged into a three-dimensional file format with Imaris converter and visualized using Imaris33.
Probing potential immunological response and liver toxicity after systemic STV-C8 injection in mice
PBS (as a control for untreated mice) or 50 µl of STV-C8 was injected intravenously into female C57BL/6J mice (11 weeks old, Charles River Laboratories). On days 1 and 3 post-injection, mice were euthanized using carbon dioxide (CO2) inhalation in accordance with institutional animal care guidelines and with the approval of the Ethical Review Board of the Government of Upper Bavaria (Regierung von Oberbayern, Munich, Germany) (ROB-2532.Vet_02-23-143). Blood samples were collected by means of cardiac puncture, and liver tissues were immediately excised for subsequent analysis. Serum alanine aminotransferase levels were measured by ALAT (GPT) FS (IFCC mod.) assay on a respons910 random-access clinical chemistry analyser (DiaSys Diagnostic Systems). Liver tissue was homogenized, and total RNA was extracted from the aqueous phase using a NucleoSpin RNA Mini Kit (Macherey-Nagel). Then, 400 ng of RNA was reverse transcribed into complementary DNA (cDNA) using a PrimeScript RT Reagent Kit (TaKaRa), and RT–qPCR of RNA samples was performed using PowerUp SYBR Green Master Mix (Applied Biosystems) on a QuantStudio 3 Real-Time PCR System (Applied Biosystems).
EGFP mRNA delivery into differentiated mouse myotubes
C2C12 mouse myoblasts (a gift from the Institute of Developmental Genetics, Helmholtz Munich) were differentiated into myotubes by cultivation in DMEM supplemented with 2% horse serum. Successful differentiation was verified through formation of multinucleated cells. Differentiated myotubes were then treated with STV-C8(EGFP) for 2 days, and EGFP expression was analysed by flow cytometry.
In vivo treatment of porcine muscle cells to delete exon 51 from the dystrophin gene
Large animal work was approved and ethically monitored by the Bavarian local authority (ROB-55.2-2532.Vet_02-19-39). STV-C8(Cas9/sgRNA) were produced in coated 10-cm dishes and concentrated by ultracentrifugation as described before. To provide a proof of concept, a 3-month-old 25-kg wild-type German landrace pig was sedated by intramuscular injection of ketamine and azaperone. Fentanyl was injected intravenously through a 20-G catheter in the ear vein to provide analgesia during the procedure. Subsequently, the prospective injection site on the right hind limb was shaved and disinfected, and 1 ml of concentrated STV-C8 vector was injected at 1.75 cm depth, using a 1-ml Luer lock syringe equipped with a 22-G safety needle, into the right M. biceps femoris. After injection, the pig was monitored until regaining consciousness and assessed twice daily for the following 3 days for clinical signs of infection, inflammation or any adverse reaction to the injection. After 3 days, the animal was sedated according to the protocol above and euthanized by intravenous injection of pentobarbital. Systematic tissue sampling surrounding the injection site and the uninjected contralateral leg, as well as the M. latissimus dorsi, was performed after cardiac arrest. Genomic DNA was extracted from all procured samples using a Monarch Genomic DNA Purification Kit (NEB). PCR was performed using Platinum SuperFi II Master Mix (Thermo Fisher Scientific) was performed with primers CCCATGACATTTACCCTATTATTATCCC and GCTAATGTTCATTTTAAAAAGGAATCTGTC, and the deletion efficiency was assessed on an agarose gel by comparison of band intensities. The resulting bands at 2 kb (wild type) and 1 kb (genomic deletion) were extracted from the gel and verified by Sanger sequencing (Microsynth). In addition, the PCR product was sequenced using Oxford Nanopore sequencing (Eurofins Genomics), and the deletion frequency was analysed using Geneious Prime (2025.1.2, Dotmatics).
Analysis of immunological response to local STV-C8 injection in pig muscle
RNA was extracted from muscle tissues by phenol–chloroform extraction. Induction of inflammation-related genes after STV-C8 treatment was evaluated by RT–qPCR in four experimental groups, using TBP as an endogenous control gene. The target group consisted of muscle samples from STV-C8-injected regions. Non-injected muscles from the same animal and muscle samples from untreated animals were used as negative controls, whereas muscle samples from rejected tissue were used as positive indicators of strong inflammatory response.
iPS cell differentiation into myotubes and treatment of patient-derived cells
Skeletal muscle differentiation of control and DMDΔ52 hiPS cells was performed using an SKM-KIT (Amsbio). For STV-C8 transduction, wild-type or patient-derived myoblasts were seeded at a density of 40,000 cells cm−2 on collagen I-coated plates (5 µg cm−2; Sigma-Aldrich, 122-20) in skeletal muscle myoblast medium (SKM02). At confluence, myoblasts were switched to skeletal muscle myotube medium (SKM03) to induce differentiation. After 4 days, myotubes were transduced with STV-C8 or left untreated. Live-cell imaging was performed 24 h and 72 h after transduction, followed by fixation at 72 h and DAPI staining. For STV-C8(Cas9)-treated conditions, RNA was collected following transduction at 96 h. Subsequently, the RNA was converted into cDNA using a Maxima First Strand cDNA Synthesis Kit (Thermo Fisher) and amplified with primers binding to exons 49 and 54 of the DMD gene. In addition, RNA from RPS18 was amplified to confirm the quality of the extracted RNA. The expected sizes of the amplified cDNAs from treated and untreated cells were analysed by agarose gel electrophoresis, and the integrity of the splicing events was confirmed by nanopore sequencing of the PCR product.
Statistical analysis and reproducibility
Statistical tests of the numerical data were performed and graphical representations were produced using GraphPad Prism. Unless otherwise stated, immunofluorescence images and gel electrophoresis images are representative of at least three independent experiments. Sample sizes were chosen on the basis of previous experience and expected experimental variability, with at least biological duplicates unless otherwise stated. For in vivo studies, animals were randomly assigned to experimental groups after enrolment. Blinding was not applied to most in vitro and molecular experiments, because outcomes were based on objective quantitative measurements analysed using predefined criteria or standardized analysis pipelines. Samples from different groups were processed in parallel under identical conditions, and automated image analysis or computational data processing was used where applicable to minimize bias.
Reporting summary
Further information on research design is available in the Nature Portfolio Reporting Summary linked to this article.