


Tissue dissociation, sample fixation and storage
Cells were isolated from the developing human cortex between GW15 and GW24 using a method similar to that previously described in ref. 3. Dissociated cells were washed twice in PBS and fixed in 2% PFA for 10 min at room temperature. Fixation was quenched by adding glycine to a final concentration of 200 mM, followed by incubation for 5 min at room temperature. From this point onwards, all procedures were performed either on ice or at 4 °C. Fixed cells were pelleted by centrifugation at 1,000g, washed once with PBS, filtered through a 70-μm nylon mesh and washed once again with PBS. Finally, the cells were pelleted and stored at −80 °C.
FACS
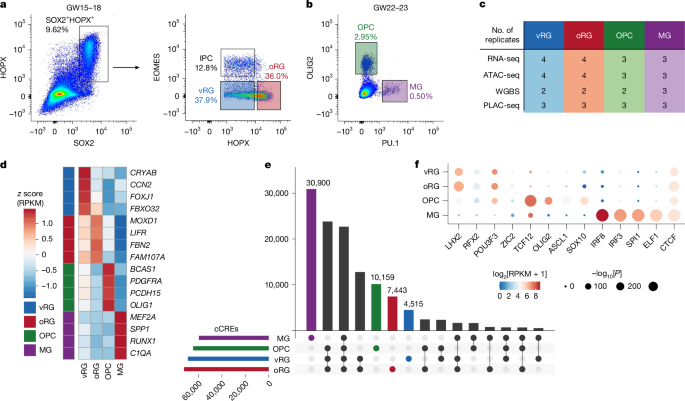
All procedures were performed either on ice or at 4 °C. About 1.5 × 10⁸ fixed cells were thawed and permeabilized by incubating in 1 ml of PBS containing 0.1% Triton X-100 for 15 min. Bovine serum albumin (BSA) was added to a final concentration of 1% and cells were pelleted by centrifugation at 1,000g for 8 min. Cells were washed once in staining buffers (PBS with 1% BSA) and resuspended in 100 µl of staining buffer. Cells were blocked by FcR Blocking Reagent (Miltenyi Biotech, 1:20) for 10 min, followed by antibody incubation for 30 min. The antibodies used for FACS included PerCP-Cy5.5 anti-SOX2 (BD Biosciences, 561506, for RG), PE-Cy7 anti-EOMES (Invitrogen, 25-4877-42, for RG), unconjugated anti-HOPX (Proteintech, 11419-1-AP, for RG), Alexa Fluor 647 anti-OLIG2 (Abcam, ab225100, for OPC/MG) and PE anti-PU.1 (Cell Signaling Technology, 81886, for OPC/MG). The HOPX antibody was used at 1:250 dilution, whereas all other antibodies were used at 1:20 dilution. After incubation, cells were washed twice in staining buffer, resuspended in 300 µl of staining buffer and incubated with the Alexa Fluor 647 donkey anti-rabbit secondary antibody (Invitrogen, A-31573, for RG FACS only) at 1:300 dilution. Cells were sorted using BD FACSAria II sorters into collection buffer (PBS with 5% BSA) (Supplementary Figs. 1 and 2). Sorted cells were pelleted by centrifugation at 1,000g for 10 min, snap-frozen on dry ice and stored at −80 °C before further processing. For FACS performed for RNA-seq, 1% RiboLock Rnase Inhibitor (Thermo Scientific, EO0384) was included in all buffers.
RNA-seq library creation and analysis
We extracted total RNA from the sorted cell populations using the RNA FFPE kit (Qiagen 73504) starting with 3 × 10⁵ to 1.8 × 10⁶ cells. The quality of the extracted RNA was checked by determining the percentage of RNA fragments with size larger than 200 bp (DV200) from the Agilent 2100 Bioanalyzer, with DV200 ≥ 30% used for library construction. Samples were then depleted of ribosomal RNA using the KAPA RNA HyperPrep Kit with RiboErase (HMR KK8560) and we performed first and second strand synthesis, dA-tailing and sequencing adapter ligation. Last, sequencing adapters were added by means of PCR amplification and libraries were sent for paired-end sequencing on the NovaSeq S4 instrument (100 bp paired-end reads).
Raw reads were trimmed to 100 bp using fastp75 (v.0.22.0) and then aligned to hg38 using STAR (v.2.7.10a) running the standard ENCODE parameters. Strand-specific quantification was performed using RSEM (v.1.2.28) with the GENCODE 38 annotation. Library quality was further evaluated with median TIN76 score and shown to be greater than 60 across all samples. TMM-normalized reads per kilobase per million mapped reads (RPKM) values for each gene were obtained by use of the edgeR77 (v.3.32.1) package. The mean values across all replicates were used for all downstream analyses. DEGs were identified with DESeq278 using a multi-factor design including the genotype or individual to identify differences between vRG and oRG. Clustering was performed on regularized log transformation data and hierarchical clustering based on sample distances after removing batch effects from genotype or individual with the removeBatchEffect command from limma79 (v.3.46.0).
Characterizing bulk RNA-seq with scRNA-seq
We leveraged CIBERSORTx80 to characterize cell composition with matching scRNA-seq9. eN, iN and IPC subclusters were first combined into one cluster before creating the reference matrix. Final counts consisted of eN, iN, IPC, vRG, oRG, truncated RG, OPC and MG cluster. Raw counts of bulk vRG, oRG, OPC and MG libraries from this study were obtained with tximport() from the rsem output. Finally, CIBERSORTx was used to impute cell fractions with the following parameters, batch correction B-mode, relative run-mode and 100 permutations.
ATAC-seq library creation and analysis
ATAC-seq was conducted in a similar way to that previously described in ref. 3. In brief, 50,000–100,000 formaldehyde fixed and sorted cells were resuspended in nuclei extraction buffer (10 mM Tris-HCl pH 7.5, 10 mM NaCl, 3 mM MgCl2, 0.1% Igepal CA630 and 1× protease inhibitor) at 4 °C for 5 min. Next, cells were resuspended in 50 μl of 1× TD buffer from Nextera DNA Library Prep Kit (Illumina FC-121–1030) and incubated with 2.5 μl of TDE1 enzyme for 45 min at 37 °C with 4,500 rpm. Afterwards, 150 μl of reverse crosslinking solution (50 μl of 1 M Tris pH 8.0, 100 μl of 10% SDS, 2 μl of 0.5 M EDTA, 10 μl of 5 M NaCl, 800 μl of water and 2.5 μl of 20 mg ml−1 proteinase K) was added and incubated at 65 °C overnight. DNA was purified using Qiagen MinElute kit (28004), PCR amplified and last size-selected for fragments between 300 bp and 1,000 bp with AMPure beads (Beckman Coulter, wsr-450437). Libraries were sequenced on the NovaSeq S4 instrument (100 bp paired-end reads). Raw reads were trimmed to 100 bp using fastp75 (v.0.22.0), mapped to hg38 and processed using the ENCODE pipeline (https://github.com/kundajelab/atac_dnase_pipelines) running the default settings. We achieve transcriptional start site enrichment scores greater than 7 (18.54–27.69) and fractions of reads within peaks greater than 0.3 (0.32–0.53) for all replicates. For each cell type, optimal overlapping peaks were used for all downstream analysis. DARs of vRG and oRG were obtained with DiffBind81 (v.3.4.11) using DESeq2 with a design as previously described to obtain DEGs and a cut-off at a false discovery rate of less than 0.01, after obtaining a consensus peak set and data normalization. ATAC-seq clustering was performed with a Spearman correlation of reads within a merge peak set across all four cell types using the multiBamSummary from deepTools82 (v.3.5.1).
WGBS library creation and analysis
DNA was isolated from sorted cell populations using the MagMAX FFPE DNA/RNA Ultra kit (Applied Biosciences, A31879) starting with 2.9 × 10⁵ to 1.5 × 10⁶ cells. Isolated genomic DNA was sonicated to 300–600 bp using a Covaris M220 and size confirmed using the Agilent BioAnalyzer. 0.5% of unmethylated lambda DNA was added to each sample to control for bisulfite conversion. Bisulfite conversion was performed using the EZ DNA Methylation Direct kit (Zymo, D5020). WGBS libraries were constructed using the Accel-NGS Methyl-seq Combinatorial Dual Indexing kit (Swift Biosciences, 38096). Library size and adapter removal were confirmed using the Agilent BioAnalyzer. Libraries were paired-end sequenced on the NovaSeq instrument (100 bp and 150 bp paired-end reads).
Fastq files for paired-end WGBS samples were trimmed for Illumina adapter sequences with an extra 15 bases removed from the 5′ end of read 2 and the 3′ end of read 1 using TrimGalore v.0.6.6 (https://github.com/FelixKrueger/TrimGalore). We used FastQC to check the quality of the raw and trimmed FASTQ files and ensure methylation biases from end repair were removed. Trimmed FASTQ files were mapped using Bismark83 v.0.16.2 with Bowtie2 (ref. 84) v.2.4.1 to genome build hg38. We used the deduplicate_bismark tool to remove duplicate reads from each sample before merging replicates of the same cell type. Unmethylated lambda DNA was spiked-in to each sample before bisulfite treatment and library prep. We mapped reads to lambda DNA genome to confirm greater than 99% bisulfite conversion efficiency of each sample. After merging replicates, methylation calls for each C context were determined using bismark_methylation_extractor. Only Cs with at least ten times coverage were used for downstream analysis.
We used methylKit85 to identify DMRs in a pairwise manner. DMRs were considered differentially methylated if there was at least a 25% methylation difference. We used MethylSeekR86 to identify unmethylated regions, LMRs and partially methylated domains.
PLAC-seq library creation and analysis
PLAC-seq was performed using the Arima-HiC+ Kit. Briefly, 2 to 4 million cells fixed with 2% formaldehyde (F79-500) were used to prepare each library. Following digestion and ligation the chromatin was sonicated with the following parameters using the Covaris S220 instrument: setpoint temperature was 4 °C, peak power was 105 W, duty factor was 5%, cycles per burst were 200 and treatment time was 300 s. Immunoprecipitation was performed using 2.5 μl of the H3K4me3 antibody (Millipore, 04-745). Sequencing adapters were added with Swift Biosciences Accel-NGS 2S plus DNA library kit and amplified with KAPA HiFi HotStart ReadyMix. Libraries were sent for paired-end sequencing on the NovaSeq S4 instruments (100 bp paired-end reads). Raw reads were trimmed to 100 bp using fastp75 (version 0.22.0).
We used the MAPS87 pipeline to call significant H3K4me3-mediated chromatin interactions at a resolution of 2 kb and range of 2 Mb on the basis of our PLAC-seq data. First, BWA-MEM was used to map raw reads to hg38. Unmapped reads and reads with low mapping quality were discarded, and the resulting read pairs were processed as previously reported. After mapping, read pairs were classified as AND, XOR or NOT interactions on the basis of whether both, one or neither of the pairs overlapped the universal anchor. To obtain the universal anchor bins, we first identified H3K4me3 peaks for each cell type with MACS2 using the options ‘-g hs –broad –nolambda –broad-cutoff 0.01’ for roughly 30 million read pairs with interaction distance shorter than 1 kb in each cell type. This resulted in 19,826 (37,241), 18,198 (35,783), 20,107 (38,480) and 18,730 (35,361) peaks (2-kb bins) in MG, OPC, oRG and vRG, respectively. Bedtools merge was subsequently performed to create a universal H3K4me3 anchor set of 24,167 (47,412 2-kb bins) peaks (Extended Data Fig. 2b). HPRep88 was used to confirm the reproducibility of biological replicates. For each sample we took roughly 10 million usable reads to avoid differences caused by sequencing depth. We found a greater than 0.9 Pearson correlation between all biological replicates. In our final analysis, merged cell types were down sampled to roughly 60 million AND and XOR usable reads to maintain a consistent depth for downstream analysis. Significant interactions were identified using a Poisson regression-based approach.
Defining cCREs
cCREs were subdivided into cCREs, cCREsAR and cCREsLMR with bedtools. Any base pair overlap between cCREsAR and cCREsLMR would be classified as cCREs. Comparatively, cCREsAR and cCREsLMR were exclusively accessible (AR) or LMR, respectively, and obtained with the ‘-v’ flag to indicate the absence of the corresponding feature. Chr. X and chr. Y were not included in the analysis. Intervene89 was used to generate an upset of cCREs and other upset plots.
TF motif enrichment analysis
Motif enrichment analysis for both cell-type-specific cCREs and DARs were conducted with HOMER34 using the findMotifsGenome.pl command. Default parameters were used except ‘-size given’ was set. TFs of significant motifs were filtered for RPKM expression greater than 10 in the matching cell type.
Heatmap of cell-type-specific cCREs
First, we determined XOR interactions specific to one cell type within our datasets containing a cCRE within the distal bin. Then the normalized contact score (observed/expected counts) for each bin-to-bin pair was determined by the observed count between bin pairs over the expected count generated by MAPs. Next, average ATAC-seq signal within each distal bin was obtained with bigWigAverageOverBed with counts per million (CPM) normalized signal. The heatmap shows the percentage of individual cell types divided by the sum of all cell types. If several peaks occur within the same distal bin, the average signal from each peak will be added together. ATAC-seq counts were further corrected for depth by quantile normalization. A similar technique was used for the transcriptome, but with RPKM of summed gene expression within the H3K4me3 anchor bin instead. The methylation percentage of distal bins were obtained by getting the average CpG methylation of ATAC peaks within the distal bin. Last, the unique interactions for each cell type were filtered to be overlapped with at least 50% of cCREs from the matching cell type.
Mouse enhancer transgenic assay
Candidate elements for VISTA mouse transgenic assays were initially selected from ATAC-seq peaks identified in RG, IPC, eN and iN3. First, ATAC-seq reads were obtained within a merge peak set and subsequently quantile normalized. Second, peaks overlapping TSSs defined by cap analysis gene expression sequencing (CAGE-seq) were removed, and remaining regions were required to participate in a 3D chromatin interaction and overlap the top 15,000 accessible orthologous regions in mouse embryonic brain at E11.5 (refs. 90,91). Last, peaks were further filtered for strong ATAC-seq signal (greater than 0.8 CPM) and cell type specificity enrichment (greater than 0.5 CPM difference), yielding 61 candidate regions, which were further manually selected to 29 elements that largely overlapped with cCRE annotations (20 out of 29) or were chromatin interacting regions (20 out of 29, of which 16 are cCREs) identified in one of the vRG, oRG, OPC and MG datasets generated in this study (Supplementary Table 4). Transgenic mouse embryos were generated as described previously in ref. 92 with the exception that mouse embryos were collected at E12.5. Transgenic mouse assays were performed in Mus musculus FVB (friend leukaemia virus B) strain mice. Dark–light cycle was 12 h on, 12 h off (light on 6:00–18:00), temperature 20.6–23.9 °C (69–75 °F) and humidity 30–70%.
VISTA elements enrichment
To determine which cCREs are associated with functional VISTA elements24,25, both neural VISTA elements (n = 1,233), defined as having neural tube, forebrain, midbrain, hindbrain, dorsal root ganglion, cranial nerve and trigeminal nerve, and negative controls (n = 1,868), defined as elements completely negative for signal, were overlapped with cCREs participating in 3D interactions and then compared to distance match control elements generated as previously described in ref. 87. Next, we compared the percentage of neural or negative elements overlapping cCREs and controls with the Fisher exact test.
To obtain potential targets of VISTA elements, positive VISTA neural elements determined to be both accessible and LMR were linked with target genes using bedtools. Target genes were further filtered for RPKM > 1 within the matching cell type.
TOBIAS footprinting analysis and network analysis
Footprinting analysis was performed on merged BAM files from several sequencing runs per cell type. TF motifs were downloaded from HOCOMOCO v.11 database93. TOBIAS30 was run using standard parameters and workflow to identify TF footprints in each cell type individually. The list of ENCODE blacklist sites was taken with the TOBIAS ATACorrect tools when correcting for Tn5 insertion bias. Samples were processed in a pairwise manner to identify differential binding. Only TFs with RPKM > 10 were plotted on the volcano plot and included in the Pearson correlation with expression.
Motif binding predictions were classified as cell-type-specific if the motif was predicted to be bound in the corresponding cell type and if the absolute log2[fold change] was greater than one between two cell types. Target genes were subsequently identified as previously described. When visualizing each TF as a network with Cytoscape, only DEGs were visualized.
Isolation and in vitro culture of oRG
The ventricular zone, inner subventricular zone and outer subventricular zone of a primary human cortical tissue sample at GW20 was dissected and dissociated using the Papain Dissociation System (Worthington Biochemical). Cells were infected with lentiviruses expressing GFP and shRNAs of either the scrambled control (shCTRL) or targeting LHX2 (shLHX2_1 and shLHX2_2) (Supplementary Table 7). After 72 h, cells were collected and blocked by FcR Blocking Reagent (Miltenyi Biotech, 1:20) for 10 min, followed by antibody incubation for 30 min. Antibodies used for FACS include LIFR (leukaemia inhibitory factor receptor)-conjugated APC (R&D systems FAB249A) and PE-Cy7 anti-ITGA2 (BioLegend, 359314). GFP, ITGA2 and LIFR triple positive oRGs were collected. Then 50,000 cells per condition were seeded into 4 wells in a 24-well plate and cultured for 7 days in RG differentiation medium (DMEM/F12, 2 mM GlutaMAX, 2% B27 without vitamin A, 1% N2 and 1× penicillin–streptomycin (Pen/Strep)). Samples were subsequently processed using the 10× GEM-X Universal 3′ 4-plex on-chip multiplexing assay, targeting a range of 1,300–5,000 cells per replicate. Libraries of individual samples were pooled and sequenced on an Illumina NovaSeq-X plus sequencer.
scRNA-seq analysis of oRG
The Cell Ranger (v.9.0.1) multi pipeline was implemented for cell barcode calling, read alignment and quality assessment using a custom human reference genome (GRCh38, GENCODE v.32/Ensembl98) with an enhanced GFP (eGFP) added according to the protocols described by 10X Genomics. Ambient RNA was removed from pooled gel bead-in-emulsions before downstream analysis with the CellBender94 (v.0.3.2) remove-background command. Next, we filtered for high-quality cells with the following criteria: (1) the number of detected genes (nFeature_RNA) was greater than 1,000; (2) less than 5% of all reads mapped to mitochondrial genes and (3) a doublet score, identified by scDblFinder95 (v.1.23.4) less than 0.3. A summary of the data quality is listed in Supplementary Table 7. The log-normalization with a size factor of 10,000, data scaling and cell-cycle regression of G2/M and S phase markers were performed in Seurat96 (v.5.4.0). Next, a nearest-neighbour graph was constructed with the first 30 principal components and clusters were identified with the Louvain algorithm. Clusters with low unique molecular identifier counts, most probably of low-quality cells, were removed and the clustering was repeated. Clusters were labelled as cell types on the basis of known marker genes (Extended Data Fig. 8c).
To identify which cell type showed the greatest difference between LHX2 knockdown and controls we used scDist35 (v.1.1.5), an R package that estimates sample difference in high-dimensional gene-expression space. For this analysis we used SCTransform97 (v.0.4.3) to normalize and scale the data as recommended. To identify changes in cell type distribution scCODA98 (v.0.1.9) was implemented with default settings.
LDSC regression
We performed LDSC for each complex neuropsychiatric disorder by leveraging joint models incorporating either cCREs participating in H3K4me3-mediated interactions or distal 2,000 bp bins targeting anchor bins overlapping H3K4me3 signal across all cell types as well as a baseline model99 in Fig. 4a and Extended Data Fig. 8c, respectively. Whereas in Extended Data Fig. 8a,b we generated a joint model incorporating baseline, data from this study and datasets of RG, IPC, eN and iN ATAC-seq peaks either participating in 3D interactions or not interacting.
Training the GKM model
Inspired by previously published studies69,70, we trained a GKM-SVM classifier to predict accessibility. For each cell type, the top 75,000 peaks were obtained for training on the basis of the MACS2 peak score. All peaks containing N bases were removed. To unify the training data, each peak was set to 1,000 bp by extending 500 bp from the summit. Negative training data were obtained with the genNullSeqs to obtain repeat and GC matched controls. To evaluate the model, we trained the model on all chromosomes except chr. 2, which was the test dataset. The ‘gkmtrain’ function of the LS-GKM package was used for training with default parameters including the wgkm kernel (t = 4). The performance was assessed on the test dataset using the ‘PRROC’ R package. Once the model was deemed successful, it was retrained using the complete dataset. To run deltaSVM, all 11-mers were generated with the ‘nrkmers.py’ python script and then evaluated by gkmpredict.
In silico testing of variants
Both reference and alternative alleles of variants were evaluated in silico similar to previous methods69. Briefly Alzheimer’s47, rare non-coding50 and SCZ53 variants were filtered with bedtools as accessible in at least 1 cell type and then extended 100 bp up and downstream to a final length of 200 bp. Next, three techniques, deltaSVM45, ISM and GkmExplain46, were used to identify candidate active SNPs. For GkmExplain, only the difference between the central 50-bp region was used. Each method performed comparably, although some outliers occurred between techniques (PCC > 0.99) (Extended Data Figs. 8a and 9a). Significant SNPs were selected if the GkmExplain, ISM and deltaSVM scores resided outside the 95% confidence interval of null t-distributions. Furthermore, prominence and magnitude scores derived from seq-lets that potentially match TF motifs were used to help provide confidence of SNPs as has previously been done in ref. 69. Unlike previous approaches, we obtained prominence and magnitude scores for both positive and negative contributions because we reasoned that the model could also learn motifs of TFs that repressive chromatin accessibility. These scores can be found within Supplementary Tables 9 and 10.
HAR enrichment testing
To test whether groups of cCREs are enriched for 3,168 annotated HARs58, we compared the overlap of cCREs of interest to the distribution of overlap with the same number of randomly sampled cCREs. For example, we observed that 4,515 unique vRG cCREs overlap with 30 HARs. Next, we randomly sampled 1,000 times. Each time, we sampled 4,515 cCREs from 121,317 cCREs obtained by merging vRG, oRG, OPC and MG cCREs and recorded the number of overlapping HARs. We thus obtained the empirical null distribution from 1,000 random samples. Last, we calculated the z score by comparing the observed 30 with the empirical null distribution. For Extended Data Fig. 9, 241,128 cCREs consisting of the union of vRG and oRG cCREs and IPC, iN and eN ATAC-seq peaks were sampled.
Obtaining HAR variants
Variants of HARs were obtained similarly to the method previously described in ref. 60. In brief, we first obtained all alignments for HARs accessible in oRG using ‘mafsInRegion’. Next, ‘msa_view’ was used to convert the file into a multiple sequence alignment file in which only hg38 and pantro4 alignments were retained. Afterwards, the ‘snp-sites’ command was used to convert the MSA format into VCF format. Similar to above, each variant was extended 100 bp up and downstream to a final length of 200 bp and then evaluated by deltaSVM, ISM and GkmExplain.
Obtaining predicted motif binding changes
To predict binding changes between human and chimpanzee we performed motifbreakR61 with the following data source, HOCOMOCOv11-core-A, HOCOMOCOv11-core-B and HOCOMOCOv11-core-C. Default parameters were used including a threshold of 1 × 10⁻⁴ and the ‘ic’ method. Only strong effects were retained and the motifs of TFs with more than 5 RPKM were retained for downstream analysis.
CRISPRi knockdown of HARsv2_1313
The CROP-seq-opti-eGFP vector, which enables co-expression of puromycin resistance (PuroR), eGFP and dual gRNAs, was generated based on the CROP-seq-opti backbone (Addgene, 106280). eGFP was inserted downstream of the PuroR coding sequence and linked through a P2A self-cleaving peptide. Two pairs of gRNAs targeting HARsv2_1313 and one pair targeting the ROCK2 promoter were designed using CHOPCHOP100 (Supplementary Table 10). Dual gRNAs were cloned into the CROP-seq-opti-eGFP vector according to a previously described protocol101.
For lentiviral production, gRNA plasmids (7.5 μg per T-75 flask) were cotransfected with pMD2.G (1.5 μg; Addgene, 12259) and psPAX2 (4.5 μg; Addgene, 12260) into 293T-LentiX cells (Takara Bio, 632180) using PolyJet transfection reagent (SignaGen, SL100688). Culture medium was replaced 18 h posttransfection and viral supernatants were collected daily for 3 consecutive days. Lentivirus was filtered using a 0.45-μm syringe filter and concentrated using Amicon Ultra-15 Centrifugal Filters (Millipore, UFC901024).
iPS cell differentiation to NPCs
Human WTC11 iPS cells stably expressing dCas9-KRAB47 were maintained in mTeSR medium (STEMCELL Technologies, 100-0274) and tested regularly for mycoplasma. iPS cells were dissociated using Accutase and seeded onto Matrigel-coated plates at a density of 2.5 × 10⁵ cells per cm2 in basal medium consisting of DMEM/F12 (Thermo Fisher, 10565018), 1× N2, 1× B27 without vitamin A, 100 μM non-essential amino acids, 0.5 mg ml−1 BSA, 1× Pen/Strep and 100 μM 2-mercaptoethanol, supplemented with 20 ng ml−1 FGF2 and 10 μM Y-27632.
When cultures reached roughly 90% confluency (day 0), the medium was replaced with neural induction medium, composed of basal medium supplemented with 10 μM SB431542, 100 nM LDN193189 and 1 μM cyclopamine. From day 1 to day 11, fresh neural induction medium was changed daily. On day 12, NPCs were dissociated with Accutase and replated onto Matrigel-coated plates at 4.5 × 10⁵ cells per cm2 in neural stem-cell medium (NSCM) (Thermo Fisher, A10509-01) supplemented with 20 ng ml−1 FGF2, 20 ng ml−1 epidermal growth factor, 1× GlutaMAX, 30 μg ml−1 heparin, 0.2 mM ascorbic acid and 1× Pen/Strep. For the first passage, NSCM was also supplemented with 10 μM Y-27632.
Beginning on day 13, NSCM was replaced every other day until cultures became super confluent and ready for the next passage (roughly 5 days). NPCs were maintained in NSCM and used for downstream experiments between days 26 and 30.
Quantitative PCR with reverse transcription
NPCs were transduced with lentivirus on day 21. Three days posttransduction, infected cells were enriched by puromycin selection for 3 days, followed by a 3-day recovery period. Total RNA was isolated using the AllPrep DNA/RNA Mini Kit (Qiagen, 80204). For complementary DNA (cDNA) synthesis, 200 ng of RNA was reverse transcribed using the iScript cDNA Synthesis Kit (Bio-Rad, 1708891). Quantitative PCR was performed using NEBNext Ultra II Q5 Master Mix (NEB, M0544) supplemented with 1× SYBR Green. The expression levels of ROCK2 were normalized to GAPDH.
Immunocytochemistry
NPCs were transduced with lentivirus on day 21, replated into 96-well plates on day 27 and fixed on day 29 with 4% paraformaldehyde. Fixed cells were blocked in PBS containing 0.1% Triton X-100 and 5% horse serum. Primary antibodies diluted in blocking solution were applied overnight at 4 °C, followed by incubation with secondary antibodies for 1 h at room temperature. The following antibodies were used: rat anti-Ki67-Alexa Fluor 647 (BioLegend, 151206; 1:200), rabbit anti-EMX2 (GeneTex, GTX17164; 1:400) and donkey anti-rabbit-Alexa Fluor 546 (Invitrogen, A10040; 1:500).
Stained NPCs were imaged using the Opera Phenix Plus high-content imaging system (Revvity) with a ×20 water-immersion objective. Image analysis was performed using the built-in Harmony software. Nuclei were identified based on basal Ki67 signal intensity (common threshold 0.30), and condensed Ki67 puncta were detected as high-intensity spots (relative spot intensity greater than 0.105). Cells were classified as Ki67-positive (Ki67+) if at least one condensed Ki67 punctum was detected within the nucleus. Mean GFP intensity was measured for each cell.
All downstream analyses were performed in R. GFP intensity values were log10-transformed for thresholding purposes. Cells with log10[GFP intensity] greater than 2.4 were defined as GFP-positive (GFP+) cells and included in subsequent analyses. This threshold was chosen on the basis of the distribution of GFP intensity in non-transduced control cells to distinguish background signal from true GFP expression. GFP+ cells from all treatment conditions were pooled and ranked according to raw GFP intensity. Cells were divided into quartiles (0–25%, 25–50%, 50–75% and 75–100%) based on the overall distribution. Quartile assignment was then mapped back to individual treatment groups. For each biological replicate in each condition, the percentage of Ki67+ cells was calculated within each GFP quartile. Ki67+ percentages in the top two quartiles, in which the CRISPRi knockdown effect became saturated, were compared between conditions. Bar plots represent mean ± s.e.m. A P value less than 0.05 was considered statistically significant.
To assess whether Ki67 positivity changed across increasing GFP quartiles within each treatment condition, simple linear regression was performed with quartile (coded numerically from 1 to 4) as the independent variable and Ki67+ percentage as the dependent variable. The slope and associated P value were extracted to evaluate the direction and statistical significance of the trend. Linear regression lines are shown with 95% confidence intervals. To compare trends between control and other treatment groups, linear regression models including an interaction term between quartile and treatment were used. The statistical significance of the interaction term was used to determine whether the slope of Ki67+ percentage across quartiles differed between treatment conditions.
Luciferase experiments
The Dual-Luciferase Reporter Assay System (Promega, E1910) was used to test activity difference between chimpanzee and human variants within HARs. HAR sequences were amplified either with the human WTC11 iPS cell genomic DNA or chimpanzee C3649 (ref. 102) genomic DNA with NEBNext Ultra II Q5 (NEB, M0544L) using the same primers for each genome (Supplementary Table 11). Next, after Xho I and Nco I digestion of the pGL4.13 vector (Promega, E6681), we cloned HAR amplified DNA elements and a synthesized minimal promoter by means of Gibson assembly (NEB, E2621L), and validated this by Sanger sequencing.
The ventricular zone, inner subventricular zone and outer subventricular zone of primary human cortical tissue samples between GW17 and GW20 were dissected and dissociated using the Papain Dissociation System (Worthington Biochemical). The isolated cells were plated into 24-well plates precoated with poly-d-lysine at a density of 1.5 × 10⁶ per well. The culture medium was composed of 1× B27 without vitamin A, 1× N2, 0.1 mM 2-mercaptoethanol, 1× non-essential amino acids, 20 ng ml−1 FGF2, 20 ng ml−1 brain-derived neurotrophic factor, 20 ng ml−1 pleiotrophin, 20 ng ml−1 platelet-derived growth factor DD and 1× Pen/Strep in DMEM/F12 medium supplemented with GlutaMAX. After 24 h, the cells were cotransfected in triplicate with roughly 495 ng of the HAR vector and pRL-CMV-Renilla luciferase vector (Promega, E2261) at a 10:1 ratio by lipofectamine 3000 (L3000001). After 48 h, cell lysates were obtained with passive lysis. Briefly, each well was washed with 500 μl of PBS, then 100 μl of passive lysis buffer was added and the plates rotated at room temperature for 15 min. Finally, luciferase signals were obtained with the GloMax plate reader. For analysis, background signal was removed by subtracting the signal obtained from non-transfected controls and then the relative firefly luciferase activity was normalized to the average minimal promoter signal within each sample.
Ethics statement
Human prenatal tissue samples were collected as de-identified specimens with previous informed consent, in strict accordance with applicable legal, institutional and ethical regulations. Acquisition, collection and use of these samples were approved by the Human Gamete, Embryo and Stem Cell Research Committee and Institutional Review Board at the University of California, San Francisco, USA. The Human Gamete, Embryo and Stem Cell Research Committee number is 10-05113. All experiments were performed in accordance with the approved protocol guidelines. All animal work was reviewed and approved by the Lawrence Berkeley National Laboratory Animal Welfare and Research Committee. Animals were inspected weekly by the Chair of the Animal Welfare and Research Committee and the head of the animal facility in consultation with the veterinary staff. The LBNL ACF is accredited by the American Association for the Accreditation of Laboratory Animal Care International.
Reporting summary
Further information on research design is available in the Nature Portfolio Reporting Summary linked to this article.