


Mice
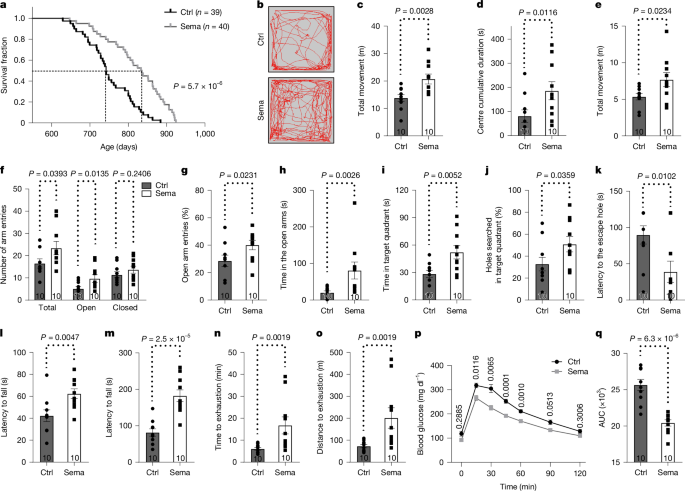
C57BL/6 mice (female, aged 20 months) were obtained from the National Institute on Aging. Mice were acclimatized for a week after arrival at the facility and before starting experimental treatments or baseline measurements. As described previously12, group housing is standard practice for calorie-restriction studies. Mice were group housed under a 12 h–12 h light–dark cycle at 20–26 °C and 30–70% humidity. Control and semaglutide-treated groups had ad libitum access to water and standard laboratory chow diet (LabDiet, Rodent Diet 5053). Calorie-restricted mice were provided with unlimited access to water and measured amount of food daily. Competition for food was minimized by placing food directly into the bottom of the cage, allowing individual mice to get a pellet. The degree of restriction was based on the mean reduction in food intake induced by semaglutide and not adjusted over time. Mice received daily subcutaneous injection of 10 nmol per kg semaglutide or an equal volume of saline. For the lifespan study, 39 mice received saline and 40 mice received semaglutide for the duration of the lifespan. For physiological, molecular and cellular studies, a separate cohort was treated for 3 months. Ten pairs for physiological assessments, five pairs for neural stem cell studies requiring tissue fixation, and six pairs for other molecular and cellular analyses. For longitudinal study, a separate cohort was treated with saline, semaglutide or calorie restriction for 5 months (10 mice per group). Measurements were assessed at the baseline, after 2 or 4 months of treatment.
For subcutaneous injection, we followed the standard operating protocol established by the animal care committee at the University of California, Berkeley. In brief, subcutaneous injections were performed daily using a 28-gauge needle in the dorsal subcutaneous region. To reduce discomfort, a new needle was used for each animal. To minimize local tissue irritation and the risk of chronic inflammation, the operator systematically rotated injection sites across the dorsal surface, ensuring no single site was used repeatedly in consecutive days. Animals were monitored daily for local reactions, including erythema, swelling, ulceration or tissue damage. No adverse effects were observed at any timepoint. On-site veterinarians were overseeing health status checks. All animal procedures were performed in accordance with the animal care committee at the University of California, Berkeley.
Lifespan
Mouse lifespan was determined according to previous studies12. In brief, mice were examined daily for survival and signs of illness. Mice found dead were noted at daily inspection. Severely moribund mice were killed and recorded. A mouse was considered severely moribund if it showed one of the following clinical signs: (1) tumour formation; (2) untreatable wounds; (3) untreatable skin ulceration or abscesses; (4) severe rectal prolapse; (5) inability to eat or drink or any condition that interferes with the ability to eat or drink, lack of response after stimulation; (6) severe dehydration; (7) respiratory distress, agonal breathing, cyanosis; (8) paralysis/paresis; (9) uncontrollable haemorrhage; (10) unrelievable, progressive hypothermia; (11) body condition score <2 out of 5. Following established practice12, both mice euthanized or found dead were represented as deaths in the survival curves. No mice were removed from the study for reasons unrelated to age-associated decline and censored in the survival analysis.
Body composition
Body composition of mice was measured using an EchoMRI-100V Body Composition Analyzer (EchoMRI). Fat mass and lean mass data were collected.
Open-field test
As described previously33, mice were acclimatized to the testing room under normal light for 1 h before testing. Mice were placed at the centre of a plastic chamber (50 × 50 cm) and allowed to move freely for 15 min. Mouse activity was recorded using a digital video camera and analysed with EthoVision (XT14, Noldus Information Technology). The central zone of the chamber was defined by the distance to the wall equivalent to the length of the mouse.
Elevated plus maze
As described previously33, mice were acclimatized to the testing room under red light for 1 h before testing. The maze consisted of two open arms and two closed arms. Mice were placed at the centre of the elevated plus maze, facing one of the closed arms, and allowed to explore freely for 10 min. Mouse activity was recorded using a digital video camera and the videos were analysed with EthoVision.
Barnes maze test
As described previously35, the Barnes maze test was conducted using a 92 cm diameter circular acrylic platform with 20 evenly spaced holes (5 cm in diameter), one of which was the target hole with an escape box. The test included three phases: habituation (day 1), training (days 2–3) and probe trials (day 5). Mice were acclimatized to the behavioural testing room for 1 h before each session. On day 1, mouse was placed under a clear beaker at the maze centre for 30 s with noise (65 dB, 1 Hz metronome), and was guided toward the target hole and allowed 3 min to enter the escape box. If unsuccessful, mouse was placed directly into the box for 1 min with the noise turned off. On day 2–3, the mouse was placed under an opaque beaker for 10 s before release. After removal, noise was initiated and the mouse was given 2 min to enter the escape box. If unsuccessful, it was guided to the target hole by a clear beaker and given 3 min to escape into the box. If unsuccessful, mouse was placed directly into the box for 1 min with the noise turned off. On day 5, a single 2 min probe trial was conducted with noise turned on but without the escape box to assess spatial memory. All trials were recorded using a digital video camera and the videos (day 5) were analysed with EthoVision.
Rotarod test
As described previously22, mice were put on a 3-cm-diameter rotating rod with an elevation of 44.5 cm (Rotamex-5, Columbus Instruments). During training days (days 1–3), mice were given habituated trials at a constant speed at 4 rpm for 60–300 s. On the test day (day 4), the mice were acclimatized to the testing room for 30 min before the experiment. The accelerated rotarod test consisted three trials where the speed increased from 4 to 40 rpm in 300 s. Each trial was separated by a 1 h interval. The fall latency was automatically recorded with infrared sensors, and the average fall latency was calculated.
Inverted screen test
As described previously35, mice were acclimatized to the testing room for 30 min before the experiment. Mice were placed at the centre of the wire cage lid, then inverted and suspended 40–50 cm above a padded surface. Timing commenced once the mice assumed a fully inverted position. The latency to fall was recorded. Each mouse underwent three trials with a 1 h interval between trials, and the average fall latency was calculated.
Treadmill exhaustion test
As described previously24, mice were placed onto the treadmill (Columbus Instruments, Exer-6M Open Treadmill). The mice were food deprived for 2 h before the training (days 1 and 2) and test (day 4). On day 1, mice were habituated on the stationary treadmill for 30 s, then run for 10 min with a stepwise increase in speed: 5 m min−1 (0–2.5 min), 6 m min−1 (2.5–5 min) and 8 m min−1 (5–10 min). On day 2, the protocol was repeated with speeds of 5 m min−1 (0–2.5 min), 7 m min−1 (2.5–5 min) and 10 m min−1 (5–10 min). On day 4, the mice were habituated for 30 s, and started running at 12 m min−1 for 40 min. The speed was then increased by 1 m min−1 every 10 min. Exhaustion was defined as the inability to resume running for at least 20 s despite gentle prodding. Time and distance were recorded.
Glucose-tolerance test
As described previously25, mice were fasted for 14 h with free access to water. Blood glucose levels were measured from tail vein blood using a CONTOUR NEXT glucometer. Following the baseline measurement, mice received an intraperitoneal injection of 2 g per kg body weight d-glucose. Blood glucose levels were then measured.
Metabolic cage
Metabolic parameters were measured using the Oxymax Comprehensive Lab Animal Monitoring System (CLAMS; Columbus Instruments).
RNA-seq analysis
Total RNA of liver samples was extracted using the RNeasy Mini Kit (Qiagen). Poly(A)-enriched RNA-seq libraries were prepared by Novogene and sequenced on the NovaSeq X Plus (Illumina) system. Data analysis was processed on the Galaxy public server (https://usegalaxy.org). In brief, after removing low-quality reads and adaptor sequences, reads were aligned to the mouse genome (mm10) using HISAT2 (Galaxy v.2.2.1). Gene-level raw counts were generated using HTSeq (Galaxy v.2.0.5). Differential gene expression was analysed using DESeq2 (Galaxy v.2.11.40.8). Volcano plots were generated using the Volcano Plot tool (Galaxy v.0.0.7). Pathway enrichment analysis was performed using GSEAPy (v.1.0.6). Transcription factor enrichment analysis of DEGs with Padj < 0.1 was performed using TRRUST. Overlap between DEGs induced by semaglutide, aging42 or calorie restriction42 was processed for GO enrichment analysis using the enrichGO function in clusterProfiler (v.4.16.0).
RT–qPCR
As described previously40, total RNA was extracted using TRIzol reagent (Invitrogen). cDNA was synthesized using the qScript cDNA SuperMix (Quanta Biosciences). Gene expression was determined by qPCR using the Eva qPCR SuperMix kit (BioChain Institute) on the ABI StepOnePlus system. All data were normalized to actin expression. The primer sequences are described in Supplementary Table 2.
NAD+ and NAD+/NADH detection
Tissues were homogenized using PBS/bicarbonate/0.5% DTAB buffer. NAD+ and NADH levels were quantified using NAD/NADH-Glo (Promega). Acid-treated samples were used to measure NAD+, and base-treated samples were used to detect NADH. Luminescence intensity was measured using the SpectraMax i3 plate reader (Molecular Devices).
ATP quantification
ATP was quantified using ATP Assay Kit (Sigma-Aldrich). The protein concentration was determined using the BCA Protein Assay (Thermo Fisher Scientific). ATP levels were normalized to protein content.
Plasma IGF1 levels
As described previously41, plasma samples were pretreated with acid–ethanol extraction solution to release IGF1 from binding proteins. IGF1 concentrations were quantified using the mouse IGF1 ELISA Kit (Invitrogen).
Western blotting
As described previously41, tissues were homogenized using RIPA buffer containing protease and phosphatase inhibitors. Protein concentration was determined by BCA Protein Assay Kit. Equal amounts of protein were separated by 12% SDS–PAGE gels and transferred to nitrocellulose membranes (Bio-Rad). After blocking with 5% BSA for 1 h at room temperature, the membranes were incubated overnight at 4 °C with primary antibodies: phospho-AKT (Ser473) antibody (CST, 9271, 1:1,000), AKT antibody (CST, 9272, 1:1,000), HSP90 antibody (CST, 4877, 1:1,000), p-eIF2α (Ser52) polyclonal antibody (Invitrogen, 44-728G, 1:1,000), eIF2α antibody (CST, 9722, 1:1,000), GRP78 antibody (Santa Cruz, 166490, 1:1,000), β-actin antibody (Santa Cruz, 47778, 1:2,000). The next day, membranes were incubated with horseradish-peroxidase-conjugated secondary antibodies (BioLegend, 406401, 405306, 1:4,000) for 2 h at room temperature. Bands were visualized with enhanced chemiluminescence substrate (PerkinElmer, NEL103001EA) using iBright CL1500 Imaging System (Invitrogen). Quantitative analysis was performed using Fiji/ImageJ (v.1.54p).
Immunostaining
Cryosections were fixed, permeabilized, blocked and incubated with primary antibodies: anti-CD68 antibody (BioLegend, 137001, 1:200), anti-IL-6 antibody (CST, 12912S, 1:200), PE-CD11b antibody (BioLegend, 101208, 1:200), FITC-CCR2 antibody (BioLegend, 150607, 1:100), anti-γ-H2AX antibody (CST, 2577, 1:200) at 4 °C overnight, followed by incubation with secondary antibodies to the CD68, IL-6 and γ-H2AX antibodies (Thermo Fisher Scientific, SA5-10018 (1:500), A-11036 (1:500), A32731 (1:2,000)) at room temperature for 2 h. DAPI was used for nuclear staining. Images were taken on the Zeiss LSM 880 confocal microscope. Five fields per mouse were randomly selected for analysis. Fiji/ImageJ was used for image quantification.
For staining of brain sections26,33, mice received intraperitoneal injections of BrdU (50 mg per kg body weight) once daily for 3 days and were euthanized on day 4. Mice were perfused with 10 ml of PBS containing 10 U ml−1 heparin, followed by 40 ml of PBS with 4% paraformaldehyde. The brains were carefully dissected and post-fixed overnight at 4 °C in PBS with 4% paraformaldehyde. The brains were transferred into PBS with 15% sucrose at 4 °C overnight, then moved into PBS with 30% sucrose at 4 °C overnight. Brains were sectioned coronally at 40 μm using cryomicrotome (Leica) and stored in cryoprotective medium. For immunostaining, brain sections were pretreated with 2 N HCl at 37 °C for 30 min (for BrdU), then blocked at room temperature for 2 h and incubated at 4 °C overnight with the following primary antibodies: anti-BrdU (Abcam, ab6326, 1:500), anti-DCX (Abcam, ab18723, 1:750), anti-HSP60 (CST, 12165, 1:500), anti-MCM2 (BD Biosciences, 610700, 1:250) and anti-SIRT7 (21st Century Biochemical, custom antibody, 1:500). The next day, the sections were incubated with the corresponding secondary antibodies (Thermo Fisher Scientific, A11006, A32731, A32733 and A-11029; 1:1,000).
For quantification, immunopositive cells in the granule cell and subgranular cell layer of the dentate gyrus were counted on every sixth coronal hemibrain section. The average number of positive cells per section was calculated and then multiplied by the total number of sections and multiplied by 2 to estimate the total cell counts for both dentate gyri. Double-positive cells were identified based on the co-localization of HSP60 or SIRT7 and MCM2 signals encircling the same DAPI-stained nucleus. The proportion of activated NSCs expressing HSP60 or SIRT7 was calculated as the ratio of HSP60+MCM2+ or SIRT7+MCM2+ double-positive cells to the total number of MCM2+ cells.
SA-β-gal staining
SA-β-gal staining was conducted using the Senescence beta-Galactosidase Staining kit (CST, 9860). In brief, cryosections were fixed with the supplied fixative solution for 15 min at room temperature. After fixation and washing, the sections were immersed in a fresh β-gal staining solution and incubated at 37 °C overnight. Images were taken on the Zeiss Axio Imager M2 microscope. Five fields per mouse were randomly selected for analysis. Fiji/ImageJ was used for image quantification.
Colony-forming unit assay
In total, 2 × 10⁴ bone marrow cells were resuspended in MethoCult GF M3434 medium (StemCell Technologies) and cultured in cell incubator. Colony-forming units (CFUs) were quantified on day 12. Bright-field images were taken on the Zeiss Axio Imager M2 microscope, and colony areas were measured using Fiji/ImageJ.
Flow cytometry and cell sorting
For HSC analysis, bone marrow cells were obtained in staining media (PBS with 2% FBS) by crushing the long bones, and stained with APC/Cy7-conjugated lineage antibodies, KIT-APC, SCA1-PB, CD48-FITC and CD150-PE antibodies (BioLegend, 101226, 108424, 116223, 100222, 100414, 100714, 103224, 105812, 108120, 103404, 115904; 1:100) for 20 min at 4 °C. Lineage antibodies included MAC1 (CD11b), GR1 (Ly-6G/C), Ter119 (Ly-76), CD3, CD4, CD8a (Ly-2) and B220 (CD45R) (BioLegend). For analysing lineage-biased HSCs, bone marrow cells were stained with PerCP/Cy5.5-conjugated lineage antibodies, KIT-APC/Cy7, SCA1-PB, CD150-PE, CD135-APC and CD34-FITC antibodies (BioLegend, 101228, 108428, 116228, 100218, 100434, 100734, 103236, 105826, 108120, 115904, 135310, eBioscience, 11-0341-81; 1:100) for 20 min at 4 °C. For MitoSOX analysis, cells were incubated with 5 µM MitoSOX Red Mitochondrial Superoxide Indicator (Thermo Fisher Scientific) for 30 min at 37 °C in the dark after HSC staining (BioLegend, 101226, 108424, 116223, 100222, 100414, 100714, 103224, 105812, 108120, 115916; 1:100).
For lineage differentiation in the peripheral blood, blood was collected through the submandibular vein into EDTA-treated tubes (BD), and lysed with 500 µl of 1× BD FACS lysing solution (BD) for 5 min at room temperature. Lysis was stopped with 3 ml of PBS, and stained with MAC1-PE, GR1-FITC, B220-APC and CD3-PB (BioLegend, 101208, 108406, 103212, 100214; 1:100) for 20 min at 4 °C. All data were acquired using the LSRFortessa flow cytometer (BD) and analysed using FlowJo (v.10.9.0).
For HSC sorting, bone marrow cells were lysed with ACK buffer and enriched for KIT+ cells with KIT microbeads (Miltenyi Biotec). KIT-enriched cells were stained with APC-Cy7-conjugated lineage antibodies, KIT-APC, SCA1-PB, CD48-FITC and CD150-PE antibodies (BioLegend) for 20 min at 4 °C, and stained with propidium iodide (0.5 µg ml−1). Live HSCs were sorted using the FACSAria sorter (BD).
Statistical analysis
The number of mice chosen for each experiment was based on the principle that the minimal number of mice is used to have sufficient statistical power and is comparable to published literature for the same assay performed. Mice were randomized to groups. Data collection and analysis of mice and tissue samples were performed by investigators blinded to the treatment of the animals, except for data collection for calorie-restricted mice, as their feeding regimens were distinguishable. Measurements were taken from distinct samples. Experiments in the study were repeated twice, except for Fig. 3. Findings in Fig. 3 were validated by experiments assessing hallmarks of ageing, genetic regulators of ageing and nutrient sensors in Figs. 2 and 4 and Extended Data Figs. 3–6. GraphPad Prism 10, Excel (v.16.84) and jamovi (v.2.7.26) were used for statistical analyses. Data were tested for normality using the Shapiro–Wilk test. Normally distributed data were tested for homoscedasticity using F-test or Brown–Forsythe test. For two-group continuous data, non-normally distributed data were analysed using the Mann–Whitney U-test. Student’s t-tests were used for data with equal variances and Welch’s t-test was used for data with unequal variances. For three-group continuous data, Kruskal–Wallis tests were used for non-normally distributed data, followed by Dunn’s multiple-comparison test, one-way ANOVA for normally distributed data with equal variance, followed by Tukey’s multiple-comparison test, and Welch’s ANOVA for normally distributed data with unequal variances, followed by Games–Howell’s multiple-comparison test. Covariate-adjusted analyses were performed using ANCOVA. Count data were analysed using generalized linear models with Poisson or negative binomial distribution when there was overdispersion. Percentage data were analysed using beta regression. GTT data were analysed using two-way repeated-measures ANOVA followed by Sidak-adjusted pairwise comparisons between groups at each timepoint. Lifespan data were analysed using the log-rank test. Categorical distribution data were analysed using the Fisher–Freeman–Halton exact test. Weekly body weight data were analysed using linear mixed-effects model, followed by Holm-adjusted pairwise comparisons between groups at each timepoint. Other longitudinal continuous data were analysed using linear mixed-effects models to assess ageing trajectories. Slopes for each group were determined and pairwise comparisons of slopes were performed with Tukey adjustment. Longitudinal percentage data were analysed using β mixed-effects models to assess ageing trajectories, with pairwise comparisons of slopes performed using Tukey adjustment. Data are presented as means and the error bars represent the s.e.m.
Reporting summary
Further information on research design is available in the Nature Portfolio Reporting Summary linked to this article.