


No/lo alcohol alternatives may look like the cheaper option on the shelf, but what shoppers actually pay reveals a more complicated picture shaped by pack sizes, purchasing patterns, and premium branding.
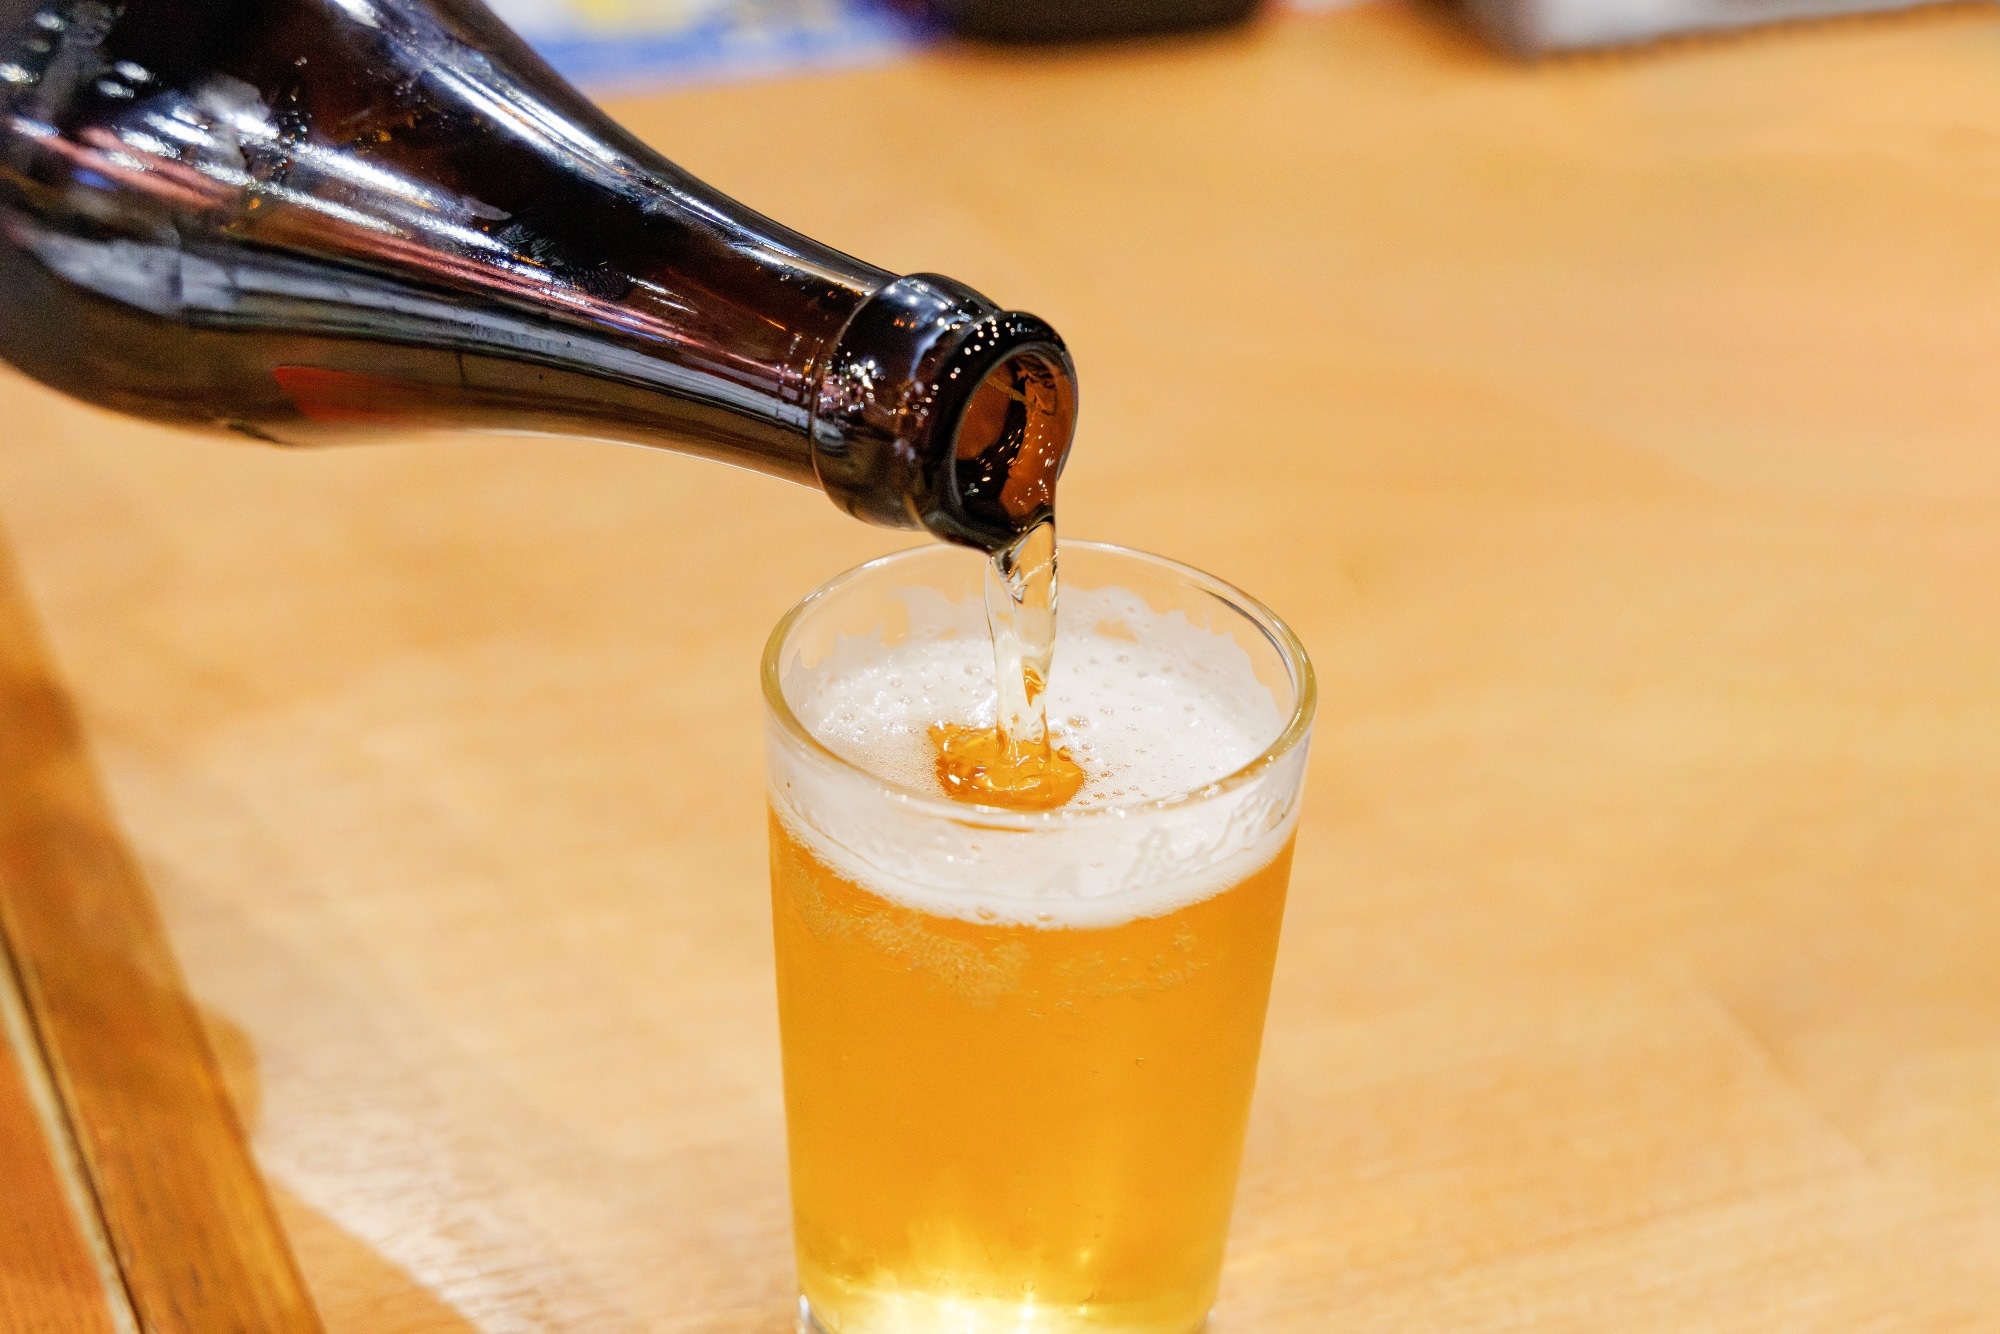
Study: Are alcohol-free and low-alcohol drinks more expensive than regular-strength drinks? A descriptive analysis of sales data from Great Britain, 2024. Image Credit: taka1022 / Shutterstock
A recent study in the journal Addiction examined whether no- or low-alcohol beverages are more expensive than regular-strength drinks in Great Britain by analyzing average prices, price distributions, and equivalent products matched by brand, pack size, and container format.
Growth and Pricing of No/Lo Alcoholic Drinks
Alcohol-free and low-alcohol (no/lo) drinks are beverages that contain little or no alcohol. The study defines no/lo products as those containing up to and including 1.2% alcohol by volume (ABV), in line with the UK Government definition. These products have become increasingly popular in Great Britain and other high-income markets, with sales volumes rising rapidly in recent years. In Great Britain, no/lo sales volume increased by 66% between 2020 and 2023, although these drinks still represented only 1.4% of total alcoholic drink sales. Although evidence on their broader public health effects remains limited and inconclusive, the main potential benefit would arise if consumers substituted no/lo products for regular-strength drinks.
Despite their rising popularity, the pricing of no/lo drinks compared to regular-strength alcohol remains complex and not fully understood. While no/lo products are generally cheaper among the products available for sale, there are important exceptions when prices are weighted by what consumers actually buy: no/lo beer has a higher purchase price per serving than regular-strength beer, and no/lo cider is priced similarly to its alcoholic counterpart.
Key contributing factors to these patterns include the fact that no/lo drinks are typically sold in smaller, less cost-efficient pack sizes, and that many top-selling products are associated with premium brands rather than budget alternatives. Premium branding may contribute to higher prices, even when the alcohol content is much lower.
Previous research on no/lo pricing has been limited and inconsistent, with much of the evidence dating from earlier stages of market development. There is a lack of detailed analysis regarding how pack size, container size, and type influence consumer prices.
Analysis of Price Differences Between No/Lo and Regular-Strength Alcohol
A market research dataset from Circana (Chicago, USA) provided comprehensive 2024 sales records for no/lo and regular-strength off-trade alcohol in Great Britain. Off-trade sales accounted for the majority of alcohol purchases, i.e., 73% of all alcohol and 80% of no/lo sales in 2023. Circana’s data were collected from supermarket electronic point-of-sale (EPOS) systems, some smaller retailers, and wholesalers, but excluded discount retailers such as Aldi and Lidl.
The dataset captured weekly sales value and volume for 21,147 stock-keeping units (SKUs), including 20,690 regular-strength and 457 no/lo SKUs, excluding gift sets. For each SKU, the information included ABV, beverage type, packaging, manufacturer, and parent brand.
Data were aggregated annually to minimize seasonal effects. Implausibly priced products, those below £1.00/L or above beverage-specific thresholds, were excluded, removing 603 SKUs (3%), mostly regular-strength beers, but affecting only 1% of sales volume. The final analytic sample included 20,544 SKUs (20,094 regular-strength, 450 no/lo).
Prices were calculated per liter and per standard serving size, with standard serving sizes based on weighted medians for beer, cider, and ready-to-drink (RTD) products, and on typical servings for wine and spirits.
Two price measures were used: the median and interquartile range of available prices, and purchase prices weighted by the volume of liquid sold so that higher-selling SKUs contributed proportionately more to the estimate. Additional analyses included pack size, container size and type, and sales volume.
Descriptive analyses compared no/lo and regular-strength prices, with variability assessed across products. Median and purchase prices were compared across SKUs, and the researchers also examined differences in price distributions.
Wine and spirits were not included in multi-pack analyses due to their typical packaging. Analyses were restricted to container size and type combinations accounting for at least 5% of either regular-strength or no/lo sales volume within each beverage category.
Significant Trends in No/Lo Alcohol Pricing
No/lo drinks generally have lower median prices than regular-strength drinks across most beverage types, except for RTD products. However, purchase prices showed a different pattern: no/lo beer is 7% more expensive than regular-strength beer, while no/lo wine, spirits, and RTDs are less expensive than their regular-strength counterparts. No/lo cider had a purchase price only 0.4% higher, a difference of less than £0.01 per serving. Most price differences are statistically significant, although some, such as the minimal difference for cider, are unlikely to be meaningful in practice. Analyses using mean prices confirm these trends.
Although more unique no- or low-alcohol beers and ciders are available at lower prices, regular-strength beer and cider account for higher sales volume at those price points. No/lo drinks have a narrower price range, with peak prices occurring at higher levels than regular-strength drinks. For wine, spirits, and RTDs, the pattern was different: no/lo products were concentrated at lower price points, while regular-strength products tended to be more expensive outliers.
The majority of top-selling no/lo beers and ciders have direct regular-strength equivalents, but this is less common for no/lo wine, spirits, and RTDs. These matched pairs represent most sales for beer, cider, spirits, and RTDs, but a smaller proportion of wine sales, reflecting fewer equivalent brands. The authors noted that wine matching was more difficult and said those comparisons should therefore be interpreted with greater caution.
Matched product comparisons show that 37 of 52 matched top-selling no/lo products were at least 20% cheaper than regular-strength equivalents, with only three matched pairs in which the no/lo product was not cheaper. Two large-pack beers were slightly more expensive, while one wine had the same price.
Pack size and packaging format significantly impact price differences. Regular-strength beer and cider are more often sold in larger, more cost-efficient packs, increasing the savings from bulk purchases compared to no/lo options. Regular-strength RTDs also benefit from larger pack savings. In contrast, no/lo beer sometimes shows marginally greater savings from larger containers than regular-strength beer. For wine, this effect is minimal due to the dominance of the standard 750 mL bottle format.
Conclusion
Overall, most no/lo products available to buy, and most matched top-selling equivalents, were cheaper than regular-strength alternatives. However, in categories such as beer and cider, purchasing patterns and packaging sizes influence the actual price paid, sometimes resulting in higher prices for no/lo beer and essentially equal prices for cider. The premium positioning of many top-selling no/lo products may also contribute to these higher prices, despite the overall trend toward lower costs.
The findings apply to off-trade sales in Great Britain and may be less generalizable to people who regularly shop at discount retailers or convenience stores. The study also did not examine on-trade prices in pubs, restaurants, or nightclubs, where pricing patterns may differ substantially.
As the no/lo alcohol market evolves, the authors said pricing should continue to be monitored, particularly for the emerging wine, spirits, and RTD markets and across countries with different tax systems and drinking patterns. Additional research could assess whether and how price differences encourage consumers to substitute no/lo products for regular-strength alcohol, how large those differences need to be, and whether the effect varies across socioeconomic groups.
Journal reference:
- Stevely, A. K. et al. (2026) Are alcohol-free and low-alcohol drinks more expensive than regular-strength drinks? A descriptive analysis of sales data from Great Britain, 2024. Addiction. DOI: 10.1111/add.70568, https://onlinelibrary.wiley.com/doi/10.1111/add.70568